This section describes various sampling and analysis methods available for vapor intrusion investigations. This information will help you select the techniques that will best meet the data objectives. Specifically this appendix will help with the following tasks:
The investigative toolbox in this guidance is an updated version of the toolbox located in Appendix D in the ITRC guidance document entitled Vapor Intrusion Pathway: A Practical Guideline (ITRC 2007). This updated toolbox contains sampling and analysis issues and procedures specific to VI sites, with new sections for sites where PHCs are the COCs. PHCs, unlike CVOCs (with the exception of vinyl chloride), readily degrade in the presence of O2 during migration through the vadose zone, which lowers the potential risk by VI. Hence, sampling locations and some procedures can differ from those used at sites with chlorinated hydrocarbon contamination. As an example, indoor air and subslab data, commonly collected for assessing the VI pathway for chlorinated compounds, are often not the preferred approach for PHCs since indoor and ambient sources of PHCs are so common.
In many cases, the methods and tools described in this section are applicable to both petroleum and nonpetroleum vapor investigations. Each section explains how to use the tools and when they are appropriate. References are provided for additional information regarding each of the tools.
Methods Described in Appendix G
The methods presented in this appendix are not arranged in a particular order of preference. Analytical methods and related issues are discussed after the sampling methods.
A summary of the various quantitative options used to evaluate the VI pathway is provided in a matrix in Table G-5, Matrix of recommendations for various quantitative options to evaluate VI. In addition, Table G-6 provides the advantages and disadvantages of various investigative strategies.
Vapors and VI are an unfamiliar territory for many practitioners in this field (regulators, stakeholders, consultants, subcontractors). Practitioners commonly make errors with soil vapor programs and soil vapor data in three general areas: units, screening or target levels, and project goals/objectives.
A common error is assuming that ppbv is equivalent to mg/L or that ppmv is equivalent to mg/L. The units are not equivalent, and the conversion depends primarily upon the molecular weight of the compound. Converting between units (for example, mg/L to mg/m3, percent to ppmv) is also a common source of error. Prior to scoping a field program and conducting field work, performing the following tasks will help to prevent unit errors:
Most laboratories report air data in µg/m3 and ppbv. Example conversion calculations for benzene (molecular weight = 78) at 20°C (68°F) are:
ppbv = µg/m3 x (24.0/78)
µ/m3 = ppbv x (78/24.0)
Note that 24.0 is a standard conversion factor based on the ideal gas law at 20°C and 1 atm.
In order to determine what concentrations are of concern and what analytical methods are required, screening levels must be known. Screening levels vary from state to state and, in some cases, within the state itself. Screening levels are also different for different types of receptors, such as primarily residential versus commercial or industrial buildings.
Screening levels can be obtained from three primary sources:
Generally, the screening levels in agency tables are the most conservative (lowest) while the screening levels from the predictive models are the least conservative (highest). Some states only allow their tabulated screening values to be used, with no adjustment for a specific site. If you are unfamiliar with determining screening levels, then seek assistance in determining them. Refer to Appendix H in the ITRC VI guidance (ITRC 2007) for a discussion of how to determine screening levels.
Note that for PVOCs, generic screening levels for groundwater and soil gas tend to be overly protective (conservative) because these levels rarely account for biodegradation in the vadose zone.
Defining the objectives and goals of a study should always be part of planning a project. Planning tools, such as the USEPA’s DQO process, can be used to help ensure that data of the right quality, type, and amount are collected. Clearly defining project objectives and goals also helps in selecting the appropriate sampling methods and locations. Data quality is defined within the discussion for each specific tool because quality requirements may differ according to the tool chosen.
Project goals and objectives are typically addressed during preparation of the work plan. Any planning process that follows the scientific method may be used; however, the USEPA’s seven-step DQO process (USEPA 2006b) specifically addresses many of the issues that commonly arise during environmental investigations.
The USEPA’s DQO process includes the following seven steps:
Specifying analytical data quality is covered under measurement quality objectives outlined in Step 6 of the DQO process and may include the following:
Identify and collect quality control samples (field blanks, duplicates).
Recent studies have shown that for PHCs, shallow groundwater concentration data do not correlate well with soil gas concentrations and thus are not a good predictor of the PVI risk (Lahvis et al. 2013). This poor correlation is most likely due to biodegradation in the vadose zone. In general, groundwater data overpredicts risk because groundwater screening values are usually developed without considering biodegradation in the vadose zone.
In many situations, shallow groundwater data that are already available prior to initiation of a VI investigation are sufficient to use as part of a VI investigation, especially if groundwater contamination has been delineated and the plume has reached steady-state conditions (no longer expanding). In deciding whether existing data are sufficient, consider the site-specific CSM. Groundwater data should be obtained from wells screened across the water table at the time of sampling. In addition, the sampling method used, the construction of existing wells sampled (such as screen length and placement across water table), depth of groundwater, the type of contaminants present, and heterogeneity of the vadose zone and shallow saturated zone media will likely be the most important factors in determining whether existing data are sufficient for VI assessment.
Data from potable or nonpotable wells may or may not be appropriate for use in a PVI investigation depending on how they are constructed and screened. In most situations, it is likely that few drinking water wells are screened/open across the water table. Therefore, the presence of volatiles in private or public drinking water wells could be considered a possible basis for further investigation, but in most situations the data should not be used to evaluate the potential for PVI.
If groundwater data immediately upgradient (and closest to the contamination source) from the structure are not available, surrounding data points can be used to construct contaminant isoconcentration maps. Complex geologic settings or the anticipated presence of steep concentration gradients warrant a denser sampling grid. When developing groundwater contours, consider the rate and direction of groundwater flow and the time since chemicals were released in order to compare the expected length of the plume to measured concentration data.
The USEPA (2002b) and various state agencies (NJDEP 2013a) provide specific guidance and procedures for the installation of groundwater monitoring wells and the acquisition of high-quality groundwater VOC sample data. Some of the recommendations (CAEPA-DTSC 2011) for collecting groundwater data suitable for VI assessment are:
Groundwater samples should be collected as close, horizontally and vertically, to the structures as possible because concentrations are not always uniform within a plume because of heterogeneities in source areas and in the subsurface media. Changes in surface cover that significantly affect the amount of infiltration upgradient from structures should be considered in choosing sampling locations. For example, if there is an area of groundwater recharge (such as a stormwater retention pond or a transition from a mostly paved surface to a vegetated area) located between the upgradient edge of a plume and a structure, a sampling location downgradient of the recharge area will be representative of any fresh water lens that may be present.
If a perched water table exists above the regional water table, it may be appropriate to collect samples from both the perched zone and regional shallow aquifer. Perched saturated zones that are laterally contiguous under or near structures, exist year round, and are below nearby building foundations should be sampled if they are of sufficient thickness to provide a sample. In the above scenario, sampling of the regional water table may not be vital to investigating the VI pathway.
In some situations, vertical profiles of shallow groundwater contamination may yield a more precise evaluation of the current and potential future risk of VI.
After an initial VI investigation has been completed, long-term groundwater monitoring to reevaluate the VI pathway may be appropriate in some situations. Groundwater monitoring may be appropriate where groundwater concentrations exceeding screening levels are close to, but not currently within, the applicable distance criterion to a potential receptor.
Table G-1, prepared by the NJDEP (2005), gives a summary of some alternative groundwater sampling methods that may have application to VI investigations. No-purge sampling methods may also be allowed by the local regulatory agency. Sampling guidance for VI investigations may differ from other investigatory purposes because of the objective to determine shallow groundwater quality.
|
Methods |
Example guidance documents |
Advantages or disadvantages |
|---|---|---|
|
Direct push and alternate groundwater sampling methods |
NJDEP Field Sampling Procedures Manual (NJDEP 2005), Section 6.9.2.1 |
|
|
Passive samplers
|
|
May not be adequate where:
|
|
Low-flow purging and sampling |
NJDEP Field Sampling Procedures Manual (NJDEP 2005), Section 6.9.2.2 and 6.9.2.3 |
|
|
Volume-averaged purge and sample collection |
NJDEP Field Sampling Procedures Manual (NJDEP 2005), Section 6.9.2.4 |
Not recommended to generate new groundwater data specifically for VI investigations because of the potential for vertical averaging |
Passive samplers are available in several varieties, as described in the ITRC documents listed in the table above. Passive diffusive bag samplers (PDBS) currently may be the most common tool for sampling VOCs. PDBS should be deployed just below the water level in a well for a minimum of two weeks to equilibrate with the well water. Significant water table fluctuations during that period will affect the appropriate depth intervals for the samplers. If the water level drops below the uppermost sampler, then transfer of volatiles from the sampler water into less contaminated well air space occurs. If the upper sampler is exposed to the air space, the upper sampler should be resuspended two feet below the current water level and retrieved after an additional two-week equilibration period. In any event, the depth to water in the well should be measured when the PDBS are installed and removed, and the position of the samplers relative to the water level should be clearly described in the report presenting the PDBS data. PDBS are not applicable to all compounds (for example, SVOCs and soluble compounds such as acetone, styrene, MTBE, and 4-methyl-2-pentanone), so the target analytes must be confirmed. Other passive samplers can be used for detecting and reporting these compounds. More information is available in the ITRC document Protocol for Use of Five Passive Samplers to Sample for a Variety of Contaminants in Groundwater (ITRC 2005a).
If evaluating the VI pathway is the only sampling objective, use two modifications to the typical low-flow purging and sampling:
Soil data are not typically used for evaluating the VI pathway because of the uncertainty associated with using partitioning equations and the potential loss of VOCs during sample collection In order to perform VI risk calculations using soil data, contaminant concentrations in soil must be converted to soil gas concentrations using assumptions about the partitioning of the contaminant into the gas phase. In the case of PHCs, calculated soil gas values from soil data often overestimate actual soil gas concentrations (Golder Associates 2007).
When it is not possible to collect soil gas samples at a site because of low permeability or saturated conditions, or soil data are the only data available, the VI pathway can be evaluated with soil data, especially for PHC sites.
When sampling soil for VOCs, the soil samples should be collected using procedures specifically designed to minimize volatilization losses, such as SW-846 Method 5035A (USEPA 2002a) and augmented USEPA Method 5035A (CAEPA-DTSC 2004). More details on the interpretation of soil data and phase partitioning calculations can be found in the CAEPA DTSC Vapor Intrusion Guidance (CAEPA-DTSC 2011). Existing soil data should be used as part of the lines-of-evidence approach. In general, soil matrix data are not recommended as a stand-alone screening tool for a VI investigation.
Site-specific soil properties such as bulk density, grain density, total porosity, moisture content, and fraction organic carbon can be measured from soil samples and the results used to replace default input parameters when models are used. Air permeability of the vadose zone can be determined from either in situ measurements or laboratory measurements. In situ measurements test a larger portion of the subsurface than a laboratory measurement of a small core sample and are the preferred method. In situ measurements of air permeability can be conducted in the shallow vadose zone, the area of the vadose zone subject to advection by building-driven depressurization, or to assess the presence of low-permeability layers in the vadose zone, which may act as partial vapor barriers.
Some agencies are considering allowing soil headspace concentrations to be used as criteria for defining sufficient thickness of nonsource (clean) soil for screening out sites for VI investigations. Factors to consider in order to obtain consistent headspace readings include:
A number of state agencies have established their own methodology; see, for instance, Massachusetts' guidance (MADEP 1994). This method uses the original jar method rather than plastic baggies.
Headspace concentrations are affected by the size of the container, amount of sample, the size of the available headspace, temperature, development time, hold time, and analysis time. In addition, the permeability of the container and any contamination from the container should also be considered. There is evidence that some baggies are not impervious to PHC vapor migration, which would lead to artificially low results—reported to be as much as a factor of two.
The issue of variable PID response at high humidity was documented in a study reported by Maine DEP (MEDEP 2009a). This study discussed the applicability of soil headspace in various scenarios. This study also reported variations in PID response by brand. PHC response over a wide range of humidity varied from unit to unit by up to a factor of four. Note that calibration on 100 ppm isobutylene does not correct for these issues (because it is a dry gas mixture) and so fails to compensate for moisture that is always present in soil samples used for headspace analysis.
Many crawl spaces are designed with vents and may allow for outdoor air exchange, so the concentration in the crawl space may be inversely proportional to the ventilation rate, which is not usually controlled. This situation can affect the sampling results, as well as the VI migration pathway analysis.
There are several options for sampling air from the crawl space. Crawl spaces can be sampled by collecting soil gas samples (active or passive), air samples (with canisters or adsorbents), or soil gas samples with flux chambers (identified as a supplemental data tool later in this appendix).
Typically, crawl space samples are collected following protocols similar to indoor air samples. For crawl spaces with limited access, a sampling tube is typically inserted horizontally through the crawl-space sidewall access ports or vertically through the overlying floor. As with soil gas or indoor air samples, enough measurements should be collected to obtain a representative value for the crawl space. Some crawl spaces, especially in colder environments, are sealed for portions of the year. For these situations, seasonal sampling is recommended.
Indoor air samples are normally collected after other environmental samples (for example, groundwater or soil gas) indicate the need to conduct an internal building-specific assessment. The analyte list should minimally focus on compounds identified in subsurface samples at concentrations above screening levels, their possible breakdown products, and potential compounds that may be useful as marker compounds. Since some state agencies require full parameter analysis, confirm the parameter list with the appropriate regulators.
The temporal variability depends on the duration of the sample. For residential settings, air samples are typically collected over a 24-hour period. Air samples for commercial and industrial settings are normally collected over 8 hours to correspond to an average work day. For commercial receptors with work days longer than 8 hours, multiple samples over the course of the work day might be appropriate. Shorter (grab samples) and longer (greater than 7-day) sampling periods may be used depending upon the site DQOs. The sample duration should be evaluated and agreed upon during the work plan preparation. In addition, confirm the appropriate ventilation conditions with the regulatory agency. Some states require that sampling only be performed in areas where windows and doors have not been opened, or air-handling systems used, for several hours.
Short term temporal variability in subsurface VI occurs in response to changes in weather conditions (such as temperature, wind, or barometric pressure) and the variability in indoor air samples generally decreases as the duration of the sample increases, because the influences tend to average out over longer intervals. Published information on temporal variability in indoor air quality shows concentrations with a range of a factor of 2 to 5 for 24-hour samples (Kuehster, Folkes, and Wannamaker 2004; McAlary et al. 2002). Long-term integrated average samples (up to several days) are technically feasible using a slower flow rate (this is the USEPA recommended approach for radon monitoring). Indoor air sampling during unusual weather conditions should generally be avoided.
Specific situations may warrant collecting indoor air samples before collecting subsurface data because of an immediate need. Examples of such situations may include, but are not limited to, the following:
This section provides general guidance for the collection and analysis of indoor air, and also identifies several key issues and considerations when using this assessment approach.
Assessing the VI pathway using indoor air analysis may be complicated by the effects of background contaminant sources (especially for PHCs, because many common consumer products contain PHCs).
Time and attention to detail during the presampling phase of the investigation are advantageous to later stages of the investigation. Many tools are available for the building survey. One of the tools used to identify background sources in the indoor air environment is the Indoor Air Building Survey and Sampling Form. This survey form allows the investigator to document information on the building, the occupants, and potential sources of indoor air contamination. The questionnaire was originally developed by NJDEP in 1997 and has since been revised for this guidance document using several similar survey forms prepared by New Hampshire Department of Environmental Services, New York State Department of Health, Vermont Department of Health, and Massachusetts Department of Environmental Protection.
Although survey forms and questionnaires are commonly used, these tools may not identify important indoor sources. These sources may be missed for a variety of reasons including, but not limited to (1) storage conditions preventing thorough visual inspections; (2) building occupants being unaware of chemicals present in consumer products; and (3) building occupants being unaware of specific products or storage locations. Handheld field screening instruments can be useful for evaluating these types of VOC sources that are unrelated to VI. Instrument sensitivity, however, is an important consideration when selecting tools for the investigation. Field-portable gas chromatograph (GC) with mass spectrometer (MS) instruments have also been used successfully to distinguish between indoor VOC sources and VI (Gorder and Dettenmaier 2011).
As part of the presampling site visit, typical entry points should also be evaluated for each building that is to be sampled. Utility corridors can act as contaminant migration pathways, allowing VOCs to travel long distances. Any foundation penetrations such as water, sewer, gas, electric and telecommunication lines, and sumps should be screened during the presampling site visit.
For commercial/industrial facilities, it is important to understand and document: (1) the use of the building spaces (offices, warehouses, laboratories); (2) the chemicals that may be associated with building industrial activities as well as building operations and maintenance; and (3) the location of spaces where chemicals may be stored or used. Keep a photographic record, as appropriate. Prior to sampling, remove all identified sources from the building and attached garage (if present) to the extent possible. Document which sources were removed and which could not be removed.
As part of the building survey, it is important to identify potential outdoor sources of COCs, especially when conducting a PVI assessment. Ambient air concentrations for PHCs often exceed regulatory screening levels. This survey should include nearby roads and adjacent land uses (such as dry cleaners, service stations, and industrial operations).
Time-integrated sampling is typically used when conducting indoor air exposure assessments associated with VI investigations. A time-integrated sample represents a sample taken at a known sampling rate over a fixed period of time. Two methods are commonly used: collection of samples in an evacuated canister and collection of samples on adsorbent media.
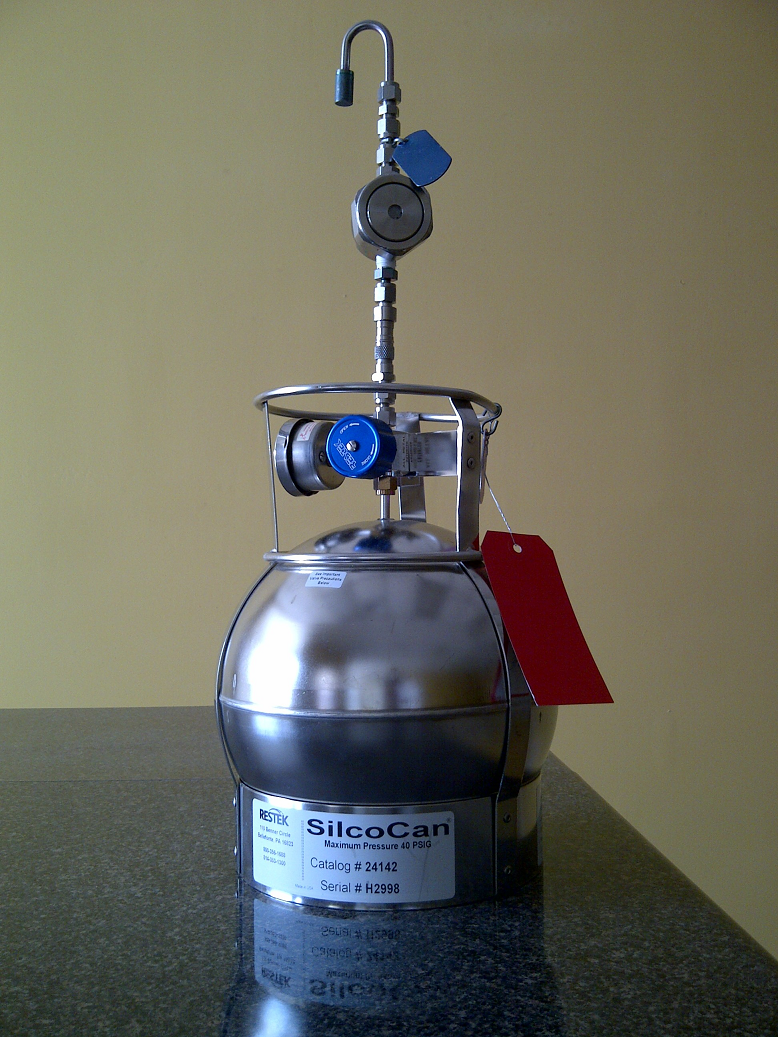
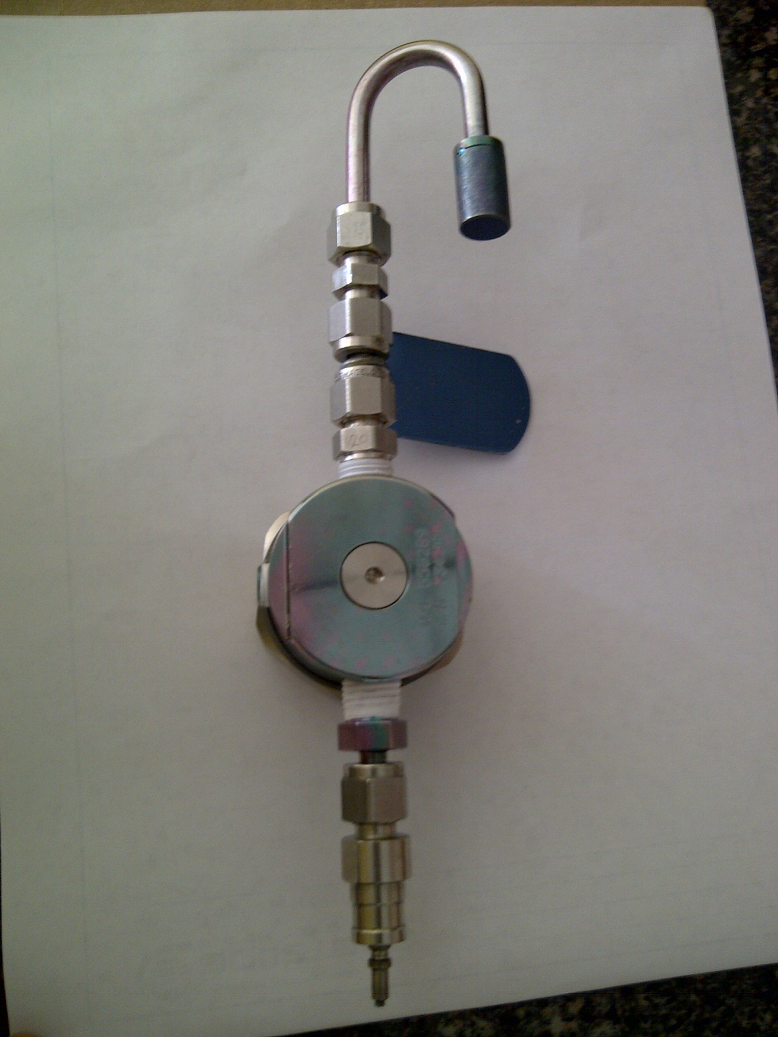
The sampling canister is a passivated or specially-lined inert container (such as a Summa or Silco canister) that is sent to the field under vacuum and is certified clean and leak free. The canister fills with air at a fixed flow rate over a preset period of time with use of a flow controller that is calibrated and set in the laboratory. The newest hardware allows for collection periods of up to seven days.
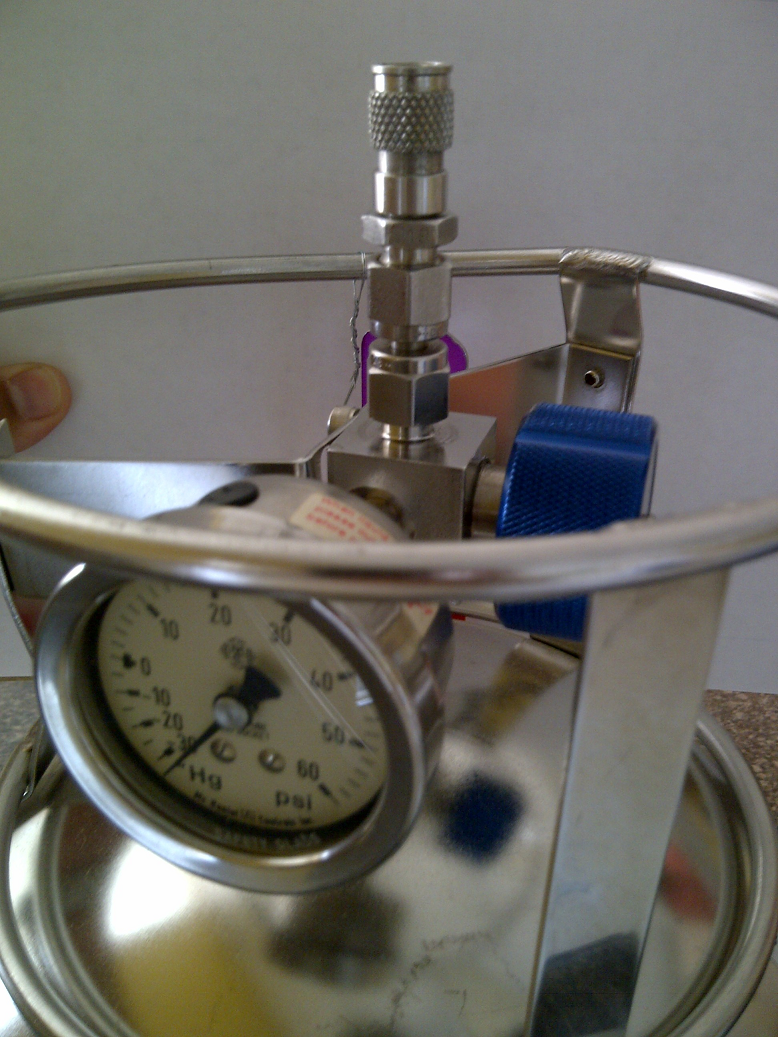
Canister Retrieval
For time-integrated samples, the canister must be retrieved with some residual vacuum remaining (not filled to 0 psig) or the collection period cannot be determined.
Initial and final vacuums are recorded for each canister. Canisters with dedicated vacuum gauges facilitate this effort and are strongly recommended. Verify that the initial vacuum in the canister is between 30" Hg and 25" Hg (given that the accuracy of the field gauges is +/-5" Hg) and record the reading. An alternative method would be to use an independent gauge to check all canisters before and after sampling. If the vacuum is less than 25" Hg (21" Hg), then do not use the canister. To ensure the canisters are filling at the proper rate, they should be rechecked after deployment. During a 24-hour sampling period, verify the vacuum somewhere between one and four hours after the start of sample collection. Replace any canister that exhibits no decrease in vacuum or an excessive vacuum decrease. At the end of sample collection, record the canister vacuum. The canister must be retrieved prior to being completely filled (with some residual vacuum remaining) or the collection period cannot be determined. Verify with the laboratory how much sample volume, which can be equated to inches of Hg, is necessary to achieve the project required detection limits. Consider having extra Summa canisters and regulators available on site in case of malfunction or a field decision to collect additional samples.
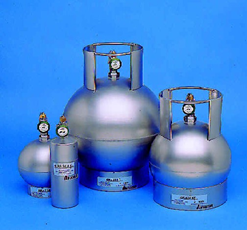
Figure G-1a. Stainless steel canisters.
Source: H&P Analytical.
|
|
|
Figure G-1b. Sampling canister sampling assembly.
Source: Mississippi Department of Environmental Quality.
The main advantages of canister sample collection are the capability to analyze multiple samples from the same canister and the ease of deployment and retrieval. Canister methods are most commonly used in North America.
Play video: Canister Cleaning and Certification Process
Sample collection on an absorbent is an option for VOCs and a requirement for SVOCs and can be done actively or passively. Active sampling requires drawing air at a calibrated flow rate through a tube containing adsorbent media over a specified time period. The flow rate and sampling volume used are determined based on the adsorbent used, the COCs, and the amount (mass) of adsorbent contained in the tube. The samples are taken to the laboratory for thermal or chemical desorption and subsequent analysis. Reporting limits are based upon the analytical instrument’s lower reporting limit and the amount of air that is passed through the tube. Air volumes must provide adequate detection limits and sampling volumes of COCs must be within the specifications of the sorbent for each COC (safe sampling volumes). It is important to use a sorbent that is certified clean and that can be reliably used for the collection and analysis of the COCs. The sample pump flow rate should be verified and documented both at the start and finish of sample collection using a calibrated flowmeter.
Passive Collectors
Passive collectors enable longer collection periods of days to weeks.
A previous disadvantage of adsorbent sampling was that typically only one analysis was possible from a tube. With current analytical instruments, multiple runs can be achieved from the same tube. Other complications of sorbent sampling are potential compound breakthrough and sorbent contamination from passive adsorption of VOCs. If there is any concern for compound breakthrough, two tubes can be collected in series to demonstrate that no breakthrough occurred.
Passive sampling of indoor air is similar to active sampling methods in which vapor constituents are collected onto adsorbents, but the collection of constituents is based on the diffusion of the compound onto the adsorbent and does not rely on pumps. As an advantage, the passive sampler is simply hung in the indoor air space to be sampled and left for a predetermined period of time. After the exposure period, the sampler is sealed in an air tight container until analysis of the media. Exposure times must be determined based on estimated sample concentrations so that the sampler does not reach a state of equilibrium (or saturation) with the environment, which would result in a low bias. This potential bias, however, is only a concern if high concentrations are expected or an inadequate amount of adsorbent is used (USEPA 2012h).
The following video includes a demonstration of passive sampling for indoor air.
Play video: Passive Sampling for VOCs in Indoor Air.
A typical single-family residential dwelling (approximately 1,500 square feet) should have one indoor air sample collected from the first floor and one from the basement or crawl space (if present). Significantly larger buildings may require additional samples, especially if there are separate air spaces or separate air handling units. Multifamily residential units and commercial or retail buildings require a more careful review of the building features. Subsurface structures may be present that would facilitate VI and thus degrade indoor air quality in one portion of the building and not another (such as partial crawl spaces, sumps, and elevators). Any sampling approach should take into account the different exposure scenarios (such as day care or medical facilities) that exist within the building and any sensitive populations that may be exposed to the contaminated vapors. Multiple indoor air sample locations are necessary for multifamily residential units and commercial or retail buildings.
Additional sampling considerations include:
When conducting indoor air sampling as part of a VI study, outdoor ambient air samples should be collected concurrently. Ambient air samples are collected to characterize site-specific outdoor air background conditions. Ambient air could possibly contain numerous VOCs, especially in highly populated or industrialized areas. The outdoor ambient air levels of some VOCs can often exceed indoor air risk-based screening levels.
Outdoor air samples should be collected from a representative location, preferably upwind and away from wind obstructions such as trees and buildings. The intake should be at about 3 to 5 feet off the ground (at the approximate midpoint of the ground story level of the building) and about 5 to15 feet away from the building.
Representative samples should be placed to minimize bias toward obvious sources of VOCs (such as automobiles, lawnmowers, oil storage tanks, gasoline stations, and industrial facilities). Outdoor air samples should be collected and analyzed by the same method as indoor air samples.
For determining ambient air concentrations, some agencies recommend that ambient sampling begin at least one hour, and preferably two hours, before indoor air monitoring begins and continue until at least thirty minutes before indoor monitoring is complete. This practice is recommended because most buildings have an hourly air exchange rate in the range of 0.25–1.0 and thus air entering the building in the period before indoor sampling remains in the building for a long time.
Flux chambers are enclosures that are placed directly on the surface (ground or floor) for a period of time, and the resulting contaminant concentration in the enclosure is measured. In theory, an effective room concentration can be calculated from the measured flux by assuming the measured flux is constant over time and over the floor area of the room, and also assuming a room ventilation rate. The calculated room concentration can be compared directly to indoor air target values for the VOC of interest. This method offers advantages in some cases because it yields the actual flux of the contaminant out of the ground, which eliminates some of the assumptions required when using other types of subsurface data. Regulatory agencies have long used this method at hazardous waste sites, and it is widely used for measuring trace emissions from natural soils; however, its application to VI assessments is relatively limited.
The testing is typically conducted in one of two modes: static or dynamic. In dynamic systems, a sweep gas is introduced into the chamber to maintain a concentration gradient across the emitting surface. The effluent air from the chamber is collected using canisters and analyzed for COCs. The method is best suited for situations where large fluxes are anticipated. In static systems, a chamber is emplaced, and the contaminant concentration buildup is measured over time. This method is best suited for situations where lower fluxes are anticipated.
Flux chambers are not well suited for structures with covered floor surfaces, such as single family residences, because the primary entry points of soil gas into the structure (cracks, holes, and sumps) are often concealed by floor coverings, walls, or stairs. For structures, the method has broader application to larger industrial and commercial buildings with slab-on-grade construction, where the slab is mostly uncovered. A building survey using a real-time analyzer or on-site GC can be used to attempt to identify the primary locations of VI.
Flux chambers are best-suited for situations where measurement from bare soils is desired, such as:
Flux chambers can also be used as a qualitative tool to locate surface fluxes of VOC contamination and entry points into structures.
Regardless of the method used, enough chamber measurements should be collected to obtain a representative value under the footprint of the building (analogous to placing enough borings on a typical site) and to ensure samples are located near edges where the slab meets the footing, over any zones with cracks or conduits, and over the center of the contamination if known. In all cases, chambers should be deployed for long enough periods to enable temporal variations to be assessed, similar to indoor air measurements (8 to 24 hours depending upon the conditions; 24 hours if large temperature differences exist between day and night (see County of San Diego Site Assessment Manual).
More details on the flux chamber method can be found in studies by Kienbusch (1986), Eklund (1992), and Hartman (2003).
Measurement of a conservative tracer inside the structure and in the subslab soil gas can allow a site-specific attenuation factor to be calculated. The calculated attenuation factor can then be used to estimate the indoor air concentration of other COCs by multiplying the measured subslab soil gas concentration by the attenuation factor for the tracer (or “marker compound”). This method assumes that all subslab vapor phase contaminants are entering the building at equal rates, a relatively safe assumption for most situations. Naturally occurring radon is the most commonly used conservative tracer. Other potential tracers include breakdown products such as 1,1- dichloroethene or cis-1,2-dichloroethene, which are generally not found in consumer products, building materials, or outdoor air. Complications to this technique include the presence of indoor sources of the tracer (if any) and any temporal variations. For colder climates, measurement during the cold and warm seasons may be prudent. If subslab samples are being collected, however,concurrent collection of radon or another tracer data may prove useful and is generally not expensive. Determination of radon concentration using adsorbents is possible for indoor air samples, but not for soil gas samples including subslab samples. Soil gas methods exist for the collection of subslab radon concentration measurements (USEPA 2006a), but analysis of the samples may not be readily available from most commercial laboratories.
The indoor air concentration is inversely proportional to the room ventilation rate: a two-fold increase in ventilation rate decreases the indoor air concentration by two-fold. The default ventilation rates used by the USEPA and many other agencies are conservative: room exchange rates of once every 1 to 4 hours for residences and once every hour for commercial buildings. For some structures, typically commercial buildings, the actual ventilation rate can be determined from the HVAC system or building design specifications, keeping in mind that the air exchange rate should be calculated from the make-up volume, not the total air handling volume. For other structures, typically residences, this information is not readily available so the ventilation rate must be either the default value or it must be measured.
ASTM Method E 741 describes techniques for measuring ventilation rates using gaseous tracers such as helium or sulfur hexafluoride. Typically, a pulse input of tracer gas in applied and the decay in concentration versus time is measured. The inverse of the air exchange rate is the slope of a plot of natural logarithm of the normalized concentration (Ct=n / Ct=0) versus time. If a subsurface tracer gas is used, this gas can serve as the pulse input. Alternatively, a tracer gas can be released at a constant rate and the concentration measured once steady-state conditions are reached (typically after three or four air exchanges).
These techniques are quick and relatively inexpensive. For colder climates, measurement during the cold and warm seasons may be prudent if the ventilation rate during the more conservative case (cold season) suggests unacceptable indoor air concentrations.
Models and look-up values used by the USEPA and many state regulatory agencies are based on assumed advective flow into the structure due to a pressure gradient of 4 Pa. This assumption can be checked in the field (using a digital micromanometer attached to a subslab soil gas probe) to provide another line of evidence to evaluate VI . It is often advisable to use a unit with data-logging capabilities because pressure differentials can change on short time scales (hourly) and assess the response to wind speed and barometric pressure changes if these data are collected.
Measurement of the pressure gradient between the structure and outdoors can assist in interpreting measured indoor concentrations of contaminants. A correlation between indoor air concentration and relative pressure can provide information on the contaminant source. For example, if a building is overpressured relative to the subsurface, then measured indoor concentrations might be more likely attributed to aboveground sources. Under these conditions, VOCs originating from above ground can also be present in subslab samples (McHugh, De Blanc, and Pokluda 2006). Conversely, if the building is underpressured relative to the subsurface, then measured indoor concentrations might be more likely attributed to subsurface sources. Commercial buildings with large HVAC systems, and perhaps residences with AC units, may fall into the former category. Many structures in cold environments, especially residences, fall into the latter category when the heaters are running. This information is usually used as a secondary line of evidence in support of indoor air quality data or other lines of evidence. Often, differential pressure measurements indicate a reversing pressure gradient that supports advective flow through the foundation in both directions, from the subsurface into the structure and from the structure into the subsurface (McHugh, De Blanc, and Pokluda 2006; McHugh and McAlary 2009).
As with any type of site investigation, it is difficult to reach conclusions with any degree of confidence with only a handful of data points. VI data sets consisting of only one soil gas or indoor air analysis per structure may be difficult to interpret, but cost and access limitations often preclude multiple analyses. Real-time analyzers can be used to collect multiple, less expensive data that can be used to locate problem structures, vapor migration routes into structures, and VOC sources inside the structures, as well as provide the functionality to collect samples at varying depths below ground surface. Continuous analyzers that collect data automatically over a period of time can sort out background scatter and determine temporal variations both indoors and below ground. Larger data sets allow trends in the results to be recognized and correlated to other variables such as pressure differentials, wind speed, and HVAC systems. Larger data sets also allow forensic approaches to be applied.
A variety of real-time analyzers exist, including handheld logging instruments (PID, FID, thermal conductivity, IR analyzers, Z-nose, and ppb RAE), automated gas chromatographs, portable mass spectrometers, and the USEPA’s own trace atmospheric gas analyzer. The applicability of many of these units is limited by their sensitivity or cost. Continuous monitoring for CH4, CO2, O2, and some VOCs, along with other environmental parameters, is currently possible. As an example, real time data for these multiple parameters can provide assurance that enough O2 is present for ongoing bioremediation of PHCs over changing environmental conditions. Temperature, barometric pressure, and changes in groundwater depth can be tracked simultaneously with concentration, so the effect of these external factors can be assessed in real time at those sites where the CSM indicates conditions may favor variable soil vapor concentrations.
Forensic approaches attempt to determine the source of any detected VOCs through a detailed study of the nature of contamination, with a focus on lines of evidence to potential sources. Traditional environmental site assessments focus on the nature and extent of contamination as determined by common methodologies which were developed to provide data for regulatory purposes.
The environmental forensics approaches are more sophisticated analytical techniques, which have the ability to produce chemical fingerprints that are source specific. Potential fingerprinting strategies include:
Forensic approaches have been used to determine whether the source of subslab contaminants were from the overlying structure or from the vadose zone (McHugh, De Blanc, and Pokluda 2006). Environmental forensics is a developing approach that will likely be increasingly important in regulatory enforcement actions and cost-recovery litigation.
A variety of weather conditions can influence soil gas or indoor air concentrations. For soil gas, the importance of these variables is greater the closer the samples are to the surface and is unlikely to be important at depths greater than 3 to 5 feet below the surface or the structure foundation. Indoor air may be more susceptible to weather conditions, therefore collection of meteorological data can be helpful to assessing the VI risk. Examples of meteorological effects include the following:
In some cases, geologic layers can form partial or complete barriers to upward vapor transport toward overlying buildings. Particular causes of these barriers include laterally-continuous, fine-grained soil layers that retain sufficient moisture to be saturated or nearly saturated. It may be possible to identify the presence of such geologic barriers using pneumatic testing, analogous to a groundwater pumping test, in which one well is used for extraction and other wells are used for monitoring the vacuum response. If the extraction well is screened below the fine-grained layer, and the monitoring probe is screened above the fine-grained layer, then the pneumatic test can be analyzed to assess whether and to what extent there is pneumatic connection between the intervals. Alternatively, a test can be conducted using two wells screened in the geologic layer below the fine-grained unit. The vacuum versus time data collected at the monitoring well are analyzed using the Hantush-Jacob (1955) leaky- aquifer solution to calculate the vertical leakage (or absence thereof) through the fine-grained “confining” layer (Thrupp, Gallinatti, and Johnson 1996). Note that this evaluation is for VI due to off-gassing from the saturated zone. These pneumatic tests provide information within the subsurface region that is stressed during the test, which can span hundreds of feet, but knowledge of the geology is important prior to inferring conditions farther from the test location.
One possible method for distinguishing subsurface VI from background sources is to collect indoor air samples with and without manipulating the pressure differential from the subsurface to indoor air (McHugh et al. 2012). This method can be accomplished by pressurizing the building or depressuring the region beneath the floor slab. In both cases, if the applied pressure differential is sufficient to prevent subsurface VI, then the concentrations of chemicals intruding from the subsurface are reduced and the concentrations of chemicals from background sources are largely unaffected. Folkes (2000) reported measured indoor air concentrations for several CVOCs before and after the operation of a subsurface depressurization system to mitigate subsurface VI.
Building pressure control can be used with on-site GC/MS analysis to distinguish between indoor sources of VOCs and VI (Gorder and Dettenmaier 2011; Beckley et al. 2014) and to address temporal variability (McHugh et al. 2012). On-site GC/MS analysis can be used to characterize the building under normal operating conditions. The building pressure can then be manipulated and indoor VOC concentrations re-measured through on-site analysis. The pattern of VOC concentration changes under different pressure conditions is then used to determine whether the building is susceptible to VI or not. For example, if VOCs are below screening levels during normal operating conditions, and remain below screening levels during induced negative pressure (condition which supports the flow of soil gas into the building), then the investigator would have more confidence that VI is not a concern in the building.
The initial criteria to apply when determining where to collect soil gas samples for VI assessments are the location of the contamination source relative to the building, the depth of the contamination source, and the type and construction of the building. The following sections recommend locations for collecting soil gas samples, both laterally and vertically, for some typical situations. Additional suggestions are available from API (2005), NJDEP (2013a), and ASTM (2006, 2009).
Selection of Sampling Locations at Sites with USTs
Though local regulatory guidance will influence the design of soil vapor surveys, the recommended approach is to make a technically defensible evaluation of the vapor pathway at either the structures of concern or at the locations with the highest contaminant concentrations at the site. If a commercial structure is on site, then collection of samples near or under the structure may be all that is necessary, even if contamination exists elsewhere on the site. At many service station sites, the contamination is typically at or near the USTs ,which can be located far from the on-site building. In such cases, if the use of the site will not change for the foreseeable future, sampling at the tank pit may not be necessary since there are no receptors over or immediately adjacent to the contamination. In contrast, if the purpose is to achieve closure of the entire site for potential redevelopment, then sampling at the highest contaminated zones is likely necessary to ensure COC concentrations that are protective for a different future use.
When subsurface contamination is encountered near buildings, soil gas samples are typically collected to assess the contaminant distribution in sufficient detail to identify buildings that may have unacceptable levels of VI. Characterization should continue until concentrations of VOCs meeting acceptable risk-based levels are encountered in the subsurface both laterally and vertically between the source and potential receptors. The exact number and spacing of samples (sample density) varies on a site-specific basis. A soil gas sample should be taken for every existing or future building for smaller sites (for example, houses surrounding a dry cleaner or a gas station). At larger sites (such as a groundwater plume under a large neighborhood), enough samples should be collected to give sufficient spatial coverage of the area over and near the contamination. For sites where current and future land use will be restricted by a land use covenant, the soil gas sampling density can be modified as a function of the size of the current and future buildings pursuant to the covenant.
When sampling near or under individual structures, collect enough samples to obtain a representative value of the soil gas concentration (analogous to placing enough borings on a typical site to characterize the extent and degree of contamination). If statistical averaging methods are being used to process the data, a minimum number of locations might be required depending on the statistical method used.
Using Exterior Soil Vapor Data
Some state agencies may not allow the use of exterior soil vapor data to evaluate the risk to an existing structure, preferring subslab soil gas data. Confer with the appropriate local agency for their specific policy and requirements.
Exterior soil vapor samples (samples not under structures) are typically collected in portions of the site where:
If the extent of the contamination is not known, and future development is anticipated, then sampling points for assessing the VI pathway are located to give representative coverage of the entire site so that no contamination zones subject to vapor migration are missed. If the extent of the contamination is known, then sampling points are located over the contamination zone. If the property use is not changing, and on-site buildings are not threatened, then it might be appropriate to only locate points at the property borders to ensure that no vapors are migrating off site. When structures exist, collect samples on the side of the structure closest to the source. Collect samples in any known subsurface migration routes, such as sewers or utility lines, that extend towards the contamination. Prior to collection, evaluate the COC list to identify the compounds present on the site. If concentrations exceeding screening levels are detected, the next step may include additional sampling of the soil gas, or it may be appropriate to proceed to interior sampling (subslab or indoor air).
Vertical profiles of soil gas concentrations can be useful for the following:
Sample locations ultimately depend on the CSM and on the location of the contaminant source to the buildings, both spatially and vertically. For PVI investigations, if all receptors on site and near the site are slab-on-grade construction, then samples may only need to be collected at shallower depths (upper 5 feet). In addition, it is often advisable that at least one additional sample be collected at a shallower depth in the event the results from the 5-foot depth exceed allowable concentrations. This sample demonstrates whether biodegradation decreases the concentrations above 5 feet. If on-site analysis exists, the decision to collect a shallower sample can be made based upon the 5-foot data. If on-site analysis does not exist, it may be prudent to collect an additional sample at 2.5 to 3 feet bgs. This sample is labeled on the chain-of-custody, and to be held pending analysis of the 5-foot sample. If the concentration in the 5-foot sample is below allowable levels, then the shallower sample need not be analyzed.
Some agencies may hesitate to accept soil vapor data at depths shallower than 5 feet bgs on the basis that a sample collected less than 5 feet bgs might be diluted by ambient outdoor air or compromised by atmospheric effects. A number of studies have documented that small variations (less than a factor of two) in soil vapor values collected from depths as shallow as 2 to 4 feet bgs demonstrate that atmospheric effects on shallow soil vapor data are minimal under typical climatic conditions. If sampling at shallower depths, then more care must be taken to avoid any chance of drawing air in from the surface. Some type of leak detection method should be used for these shallower depths.
If structures with basements or subterranean parking garages exist on site or near the site, and the contamination source is below the structure, then samples at or just below the depth of the foundation should be collected. If the contamination source is lateral to the structure, then a vertical profile of the soil vapor is recommended to assess the potential intrusion through the foundation floor and also through the foundation walls. Sampling depths should be selected to give coverage from the top to the bottom of the walls. Vertical sampling locations can also depend on the depth to groundwater and will change if the water table fluctuates.
At some sites, it is desired to document the depth of the reaction zone where conditions change from aerobic to anaerobic in order to determine the thickness of the aerobic vadose zone separating the contamination source from the building. This determination can be made by conducting a vertical profile of soil gas concentrations using field tools to screen for the presence of VOCs, O2, CH4, and CO2, which are indicator compounds of aerobic and anaerobic conditions (see Figure G-2). In general, the depth of the anaerobic vadose zone closely corresponds to the depth of contaminated soil. PHC concentrations are relatively low in the aerobic zone (where O2 is present), but can be quite high in the underlying anaerobic (O2-absent) zone. The thickness of the zone in which conditions change from anaerobic to aerobic conditions is typically less than 2 feet (Davis, Patterson, and Trefry 2009).
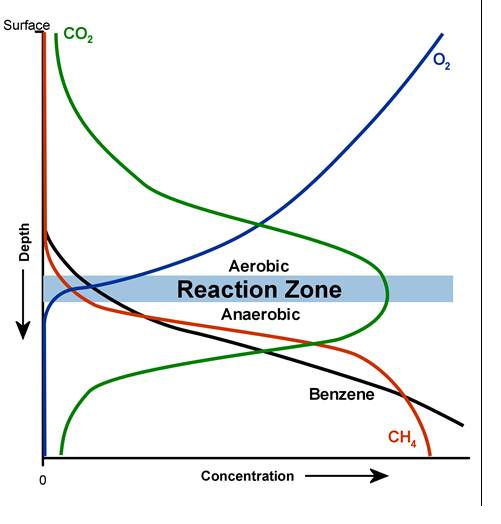
Figure G-2. Depth versus concentration plot of O2 and PHC concentrations.
Source: G. T. Ririe and R.E. Sweeney.
Note: PIDs do not respond to all PHCs. FIDs respond to all PHCs and also to methane.
Ideally, the deepest soil vapor sample point is located near the top of the contaminated soil or near the contaminated groundwater. The depth to the top of the contamination might be known from preexisting site assessment data, but it is advisable to confirm this depth in the field before installing vapor sample points. This confirmation is easily done by screening the soil vapor with a portable PID or FID or by screening the soil vapor for O2 using a portable meter. Additional soil vapor sample points are then installed from the top of the contaminated zone upward in the vadose zone. Typically, three or four sampling depths are all that are necessary to locate and document the biodegradation zone. Procedures for constructing soil vapor sampling points are discussed in the following sections.
Agency Requirements
Check to see if the oversight agency specifies the number and locations of subslab samples.
Some agencies require subslab soil vapor samples in lieu of exterior soil vapor samples when assessing the VI risk to actual structures. For small structures, single family homes, or small convenience stores, one subslab sample may be enough. A majority of current state VI guidelines, however, require more than one subslab sample (Eklund et al. 2012). If contamination uniformly underlies the structure, such as a VOC groundwater plume, the subslab sample is typically located towards the center of the structure, away from the foundation edges. If the contamination is located laterally away from the structure, such as in a tank pit or in a dispenser island, the subslab sample is typically located towards the side of the structure facing the contamination. In practice, especially in residences, the location of the subslab samples is determined more by access and floor coverings than by the location of the contamination.
Subslab sampling is intrusive and may not be possible due to access limitations or disturbances to the occupants. For chlorinated compounds, subslab sampling is typically preferred over shallow, near-slab sampling because shallow exterior soil gas samples have been shown to not match subslab samples. The situation is different, however, for PHCs.
Comparisons between near-slab soil gas profiles and subslab soil gas profiles for PHCs are reported in two USEPA modeling studies: the conceptual model scenarios report (USEPA 2012h) and the building size modeling report for PVI (USEPA 2013d). The USEPA (2012b) assumed that building foundations, basements, and slabs were impermeable and thus O2 transport was not simulated through the foundation, basement, or slab into the subsurface beneath the building. Later USEPA simulations (2013d), however, allowed for oxygen transport using reasonably-expected O2 permeability values for concrete. When O2 transport is accounted for, the differences in soil gas profiles are less pronounced between subslab samples and near-slab samples very close to the building basement and slab. The ramifications from these findings (USEPA 2013d) are that near-slab soil gas samples can be substituted for subslab samples in situations where dissolved contamination is present within 6 feet of (but not in contact with) a building basement floor, foundation, or crawl space surface, and where LNAPL is present within 15 feet of (but not in contact with) a building basement floor, foundation, or crawl space surface. For dissolved sources, this practice applies for buildings of any size, and for LNAPL sources it applies to buildings with the shortest side being no longer than 66 feet (USEPA 2013d).
A number of recent studies on the temporal variation of soil vapor concentrations due to common meteorological parameters at both chlorinated sites (Johnson and Deeb 2014; USEPA 2010b; USEPA 2007d) and at PHC sites (Luo et al. 2009; Hers et al. 2014). The results of these studies show that variations in soil vapor COC concentrations at depths as shallow as 2 to 4 feet due to temperature changes, barometric pressure, and wind speeds are typically less than a factor of two. Seasonal variations in cold climates were less than 30% (Hers et al. 2014, in press). Concentration variations are greater the closer the samples are to the surface. For shallower sampling depths (less than 2 feet bgs), larger variations can be expected in areas of greater temperature variation and during heavy periods of precipitation. Based on these studies, shallow soil vapor concentrations are unlikely to show variations greater than a factor of two, unless extreme weather conditions have occurred or the water table has changed (up or down).
Canadian Cold-Weather Temporal Study
Data from a site in Saskatchewan collected over a 12-month period showed PHC soil gas concentration variations of less than 30% (Hers et al. 2014).
Subslab concentrations of CVOCs also do not show much temporal variation. A study in progress by the USEPA from January 2011 to February 2013 showed subslab concentrations to vary by less than a factor of two underneath a house in Indianapolis (USEPA 2012h). For PHC, the study by Hers et al. (2014) showed temporal variations of less than 50% over a period 15 months.
Larger variations may be expected in areas of greater temperature variation and during heavy periods of precipitation as described below:
Temporal variations in soil gas concentrations appear to be minor compared to the conservatism built into risk-based screening levels (factor of 10 or more). Thus, it may not be necessary to repeat soil gas sampling if the measured values are some factor below soil gas screening levels, unless a major change in conditions occurs at the site (such as elevated water table or a significant seasonal change in rainfall). As an example, Australian guidance has defined a margin-of-safety factor. The number of additional sampling events required depends on how far the actual soil gas values are below the screening values. For example, if measured soil gas values are 10 times below their screening levels, then additional sampling events are not necessary. Criteria for additional sampling events are also given for margin of safety from 1 to 10.
Passive soil gas methods consist of the burial of an adsorbent in the ground with subsequent retrieval and measurement of the adsorbent. With passive sampling, there is no forced movement of soil gas by use of a pump or applied vacuum. Instead, as the vapors move by diffusion, the sorbent acts as a sink for the organic compounds in the soil gas. By collecting samples for periods of days to weeks, this method gives a time-integrated measurement and reduces the uncertainty in soil gas concentrations due to temporal variations. Depending on the sensitivity of the passive sampler, this method may also be used to distinguish between “clean” soils and those displaying characteristics of VOC presence in the subsurface.
This method can be used in investigations to provide a line of evidence on the absence, presence, and intensity of soil vapor contaminants. In general, passive samplers detect VOCs and SVOCs, including aliphatic and aromatic hydrocarbons in the range of C4–C20, volatile PAHs related to, for example, MGP sites, and VOCs related to petroleum refining and blending (such as lead scavengers and other fuel additives). Longer-term exposure times can be used to yield relatively lower detection limits.
Passive soil gas methods directly measure a mass of contaminant that has diffused onto an adsorbent media. The data provide a line of evidence on the presence, absence, and relative measurements of target VOCs and SVOCs in soil gas, as well as identify potential VI pathways into and around existing and future structures, including utility corridors. Compounds present in soil gas can be determined, and the location of sources and subsurface extent can be mapped. Reporting units are typically in terms of mass (micrograms or μg).
Using relative mass levels, passive methods offer a quick and relatively inexpensive method to find vapor migration pathways into a structure or around a structure, such as utility corridors, or in areas with significant aboveground infrastructure like refineries or bulk storage facilities.
Passive soil gas sampling methods can also be useful when active methods may not be applicable, such as in low-permeability and high-moisture settings. Because these methods are simple to deploy and retrieve, a large number of soil gas samples can be taken cost effectively. The relative concentrations can later be mapped to aid in locating sources and subsurface plumes (particularly the edges of plumes) to determine whether contamination is near current or future buildings. These concentrations can also be used to plan additional sampling schemes that focus more complex and intrusive sampling on areas where contamination is observed. Where surveys indicate the absence of petroleum contamination on a site, consider the overall sensitivity of the passive sampler (vapor uptake in the soil and analytical method sensitivity combined) before using results to screen areas out of further investigation.
Based on current regulatory-accepted analytical methods for quantitative analysis, passive soil gas is presently not applicable for stand-alone assessment of VI risk. Published methods describe the procedures to generate contaminant concentration data from a passive sorbent-based sampler in air in the absence of soil (ASTM 2002, ASTM 2003a, b), and efforts are ongoing to demonstrate the applicability of the method to soil gas (ASTM 2012). Knowledge of the passive sampler’s method detection limit as a vapor sampler is critical in data evaluation—contact the passive vapor sampler provider to discuss methods used to determine the soil gas concentration.
Passive soil gas sampling is not limited to exterior sampling locations. Subslab, near-slab, crawl space, and groundwater soil gas sampling can be performed using passive samplers. Passive soil gas sampling can be conducted on the ground surface (for example, a flux approach) and at multiple depths, usually in nested boreholes. Consider survey design and sample density and location (laterally and vertically), which may impact active soil gas sampling, when designing and implementing a passive soil gas sampling program. Additional information on use, benefits, and limitations of passive soil gas sampling in the context of VI are available from ITRC (2007), USEPA (2008), and ASTM (2012).
Special considerations include the following:
For exterior soil gas and subslab soil gas sampling, a narrow diameter hole (for example, 2.54 cm or 1 inch) is advanced to the desired sampling depth (for example, 15 cm to 1 meter). Hole depth and diameter depend on the passive sampler design and sampling objectives. Sampler depths of 3 to 4 feet or less can be accomplished using hand tools (such as a hand auger, slide hammer and tile probe, or rotary hammer drill and carbide-tipped bit). Deeper soil gas sampler installations, or deployment into larger diameter holes, may require more invasive drilling equipment and may require casing the hole. An illustration of various installation options is provided in Figure G-3.
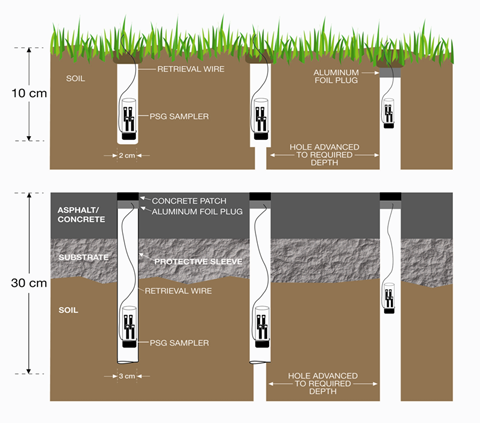
Figure G-3. Passive soil gas sampler installation options.
The sampler is lowered into the hole to the desired sample depth using a wire or string, which is then anchored at the surface by material used to seal the hole (for instance, natural, impermeable cork). This material prevents down-hole vapor infiltration and surface water from entering the hole (Figure G-4). Because there is no sample train and no forced extraction of soil gas, no leak integrity testing is required. Therefore, no sampling equipment remains on the surface after sampler installation, minimizing or eliminating the potential for equipment damage or vandalism, and allowing occupants to continue their site activities unimpeded.
The sampler is retrieved by removing the hole seal, pulling the sampler from the subsurface, and securing it in an appropriate container for transport back to the laboratory. Exposure periods depend on passive sampler design and the target reporting levels. Generally, finer-grained soils, higher soil moisture, less volatile compounds, greater depths to contaminant source, and lower reporting levels extend the sampling period. The exposure period should be long enough to achieve detectable reporting levels. Additional information can be found in the ASTM standard on passive soil gas sampling (ASTM 2012).
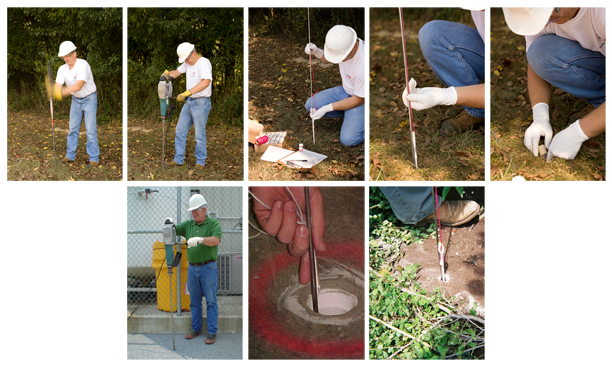
Figure G-4. Passive soil vapor sampler installation. Top: Exterior soil vapor sampling using slide hammer and rotary hammer drill, insertion of a passive soil gas sampler, and sealing the hole. Bottom: Subslab soil vapor sampling.
Source: Amplified Geochemical Imaging, LLC.
Passive samplers should be transported in a sealable container to preserve cleanliness prior to use and to prevent additional adsorption during return shipment to the analytical laboratory. Store samples away from potential sources for VOCs. No chemical or temperature preservation is typically required for transport. Passive samplers tightly sealed in their storage container can typically be held for several weeks prior to analysis. Check with the sampler manufacturer for specific hold time instructions.
The following video includes a demonstration of a passive sampling setup.
Play video: Passive Sampling Setup
Because the installation and retrieval of passive soil gas samplers is relatively inexpensive and quick, a large number of samplers can be deployed at a site to achieve good coverage. No firm guidance on soil gas sample spacing appears in current published literature. Recommendations from the New Jersey Field Sampling Procedures Manual (NJDEP 2005), suggest sample spacing on the order of 25 to 75 feet (8 to 23 meters), with smaller distances being used to locate source areas and larger distances within areas suspected to be free of contamination. Sample intervals should be a function of project budget and sampling objectives (ASTM 2006, 2014, 2009). Survey design should attempt to limit oversampling (collecting too many samples and reporting redundant data), but avoid under-sampling (collecting too few samples to resolve the features of interest). A well-designed passive soil gas survey can identify areas of the site no longer requiring further investigation, while focusing subsequent sampling in areas known to be affected.
Additional QA/QC issues regarding passive samplers are included in the ITRC VI guidance (ITRC 2007), Appendix E and Appendix F.
Active soil gas methods consist of the withdrawal and analysis of the soil gas from the subsurface. These methods give concentration data (for example, μg/m3) for COCs, which can be directly compared to risk-based screening levels or used in predictive models.
Soil gas sample collection techniques for VI applications require much greater care than techniques historically used for typical site assessment applications (such as assessing whether a UST has leaked) because the data are being used for risk assessments. The quality of soil gas data depends greatly on the collection protocols. Some of the primary factors that can influence the soil gas sample quality, and in turn the measured results of the sample, are summarized in the following sections. A checklist summarizing some of the key QA/QC issues is included in the ITRC VI guidance, Appendix E (ITRC 2007).
Two techniques are most commonly used to install soil gas probes to collect external active soil gas samples – driven probe rod and burial of soil gas sampling tubes. Both methods have been shown to give reliable, reproducible data in moderate to high permeability soils (DiGiulio et al. 2006a).
This method consists of the insertion of a hard rod (probe) driven to a target depth, collection of soil gas through the rod while it is in the ground, and subsequent removal of the rod (see Figure G-5). Soil gas probes can be constructed of a variety of materials and installed by a variety of techniques. Typically, probes are constructed of hollow steel rods with an external diameter ranging between 12.5 mm and 50 mm (0.5 inches and 2 inches). Small diameter inert, replaceable tubing runs down the center of the drive rod to eliminate potential contamination from the inside of the rods.
The probes can be driven by hand methods, direct-push systems, or with larger drill rigs using a wire-line hammer. The drive-rod method is typically faster than the buried tube method and also does not leave materials in the ground. Probe installation can be difficult in overconsolidated or coarse-grained soils, especially at greater depths, where the rods are more susceptible to deflection. A surface seal is usually used, but this seal does not prevent cross-flow at greater depths, so driven probes are most applicable in relatively uniform moderate to high permeability materials (generally not in low permeability soils). A tracer/leak check compound is required by most agencies to verify the absence of atmospheric air entry during sampling.
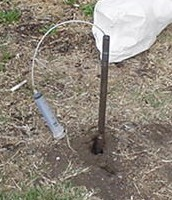
Figure G-5. Driven probe rod.
This method consists of the burial of a small diameter (typically ⅛ inch to 1 inch outer diameter) inert tube or pipe (stainless steel, Teflon, polyvinyl chloride, high density polyethylene, polyether ether ketone, Nylaflow, or similar) to a target depth with subsequent sampling of the soil gas after a period of time. Tubing may be buried in holes created with hand driven rods, direct-push systems, hand-augers, drills (for subfoundation samples) or drill rigs for deeper samples. Clean sand is used as backfill around the tip, and the remainder of the borehole annulus is sealed, usually with a bentonite and water slurry. This method is sometimes referred to as the semipermanent method (if the tubes are removed after a short period of time) or permanent method (if the tubes are left in the ground for a longer period of time), but can equally be used for temporary sampling. This method offers significant advantages when repeated sampling events are needed, or where the geology is not conducive to driven probes. Multiple tubes can be “nested” in the same borehole, if the seals between intervals are tight, and are often referred to as multilevel soil gas wells or nested probes. These probes can also be installed in nearby individual boreholes, as shown in Figure G-6.
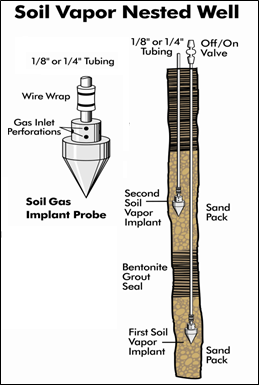
Figure G-6. Typical configuration of nested well.
Source: H&P Mobile Geochemistry.
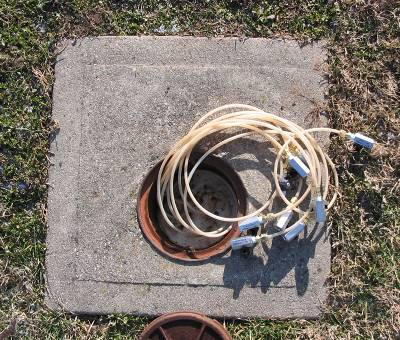
Figure G-7. Nested soil gas sample points in a single borehole (permanent probes with locking cap for repeated sampling).
Source: H&P Mobile Geochemistry.
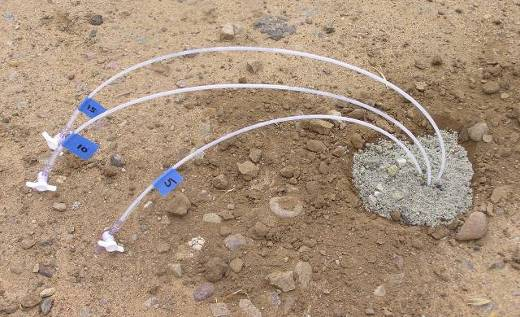
Figure G-8. Temporary probes to be removed after sampling.
Source: H&P Mobile Geochemistry.
Soil gas samples can be collected from groundwater wells that are screened across the water table and retrofitted with an air tight cap and valve. If three to five times the well casing gas volume is purged prior to sampling, the resulting soil gas sample should reflect the soil gas in the vadose zone outside of the well screen. If the casing volume is not purged, then the soil gas sample reflects contributions from both the vadose zone and from soil gas emanating from the standing water column within the lower part of the well, which is difficult to interpret and is therefore not recommended. Because of the large purge volumes required for 4 inch or 6 inch wells, the chances for sampling errors are greater than sampling soil gas with dedicated soil gas probes. Field screening with portable meters is useful to demonstrate stable readings before sample collection.
At many active service station sites, ground disturbance protocols require special probe installation protocols. Use of an air knife to clear sample locations is not recommended, so soil vapor points are generally installed by burying tubing into an open borehole as opposed to driving a steel rod into the ground and sampling through the rod. Soil vapor sampling points can be installed down a variety of boreholes ranging in diameter from 1 inch to 8 inches. Boreholes may be created with hand equipment (such as a hand auger) or by using direct-push methods when underground utilities are not present. Because of typical ground disturbance protocols, hand augering will likely be the most common method used to create a borehole.
It is important that the correct soil vapor probe materials (see Figure G-2, driven-probe rod) are used and the probes constructed properly. Following are recommended materials and construction issues for soil vapor probes.
Use tubing material that does not adsorb or off-gas volatile hydrocarbons. Recent studies by USEPA-ORD (Schumacher et al. 2009) show that nylon, Teflon, and stainless steel all give comparable results for typical PHCs. For heavier molecular weight compounds, stainless steel shows the least adsorption, but may be impractical to use. Nylon is recommended over Teflon tubing, because nylon tubing is less expensive and the compression fittings are easier to seal. Polyethylene tubing, commonly used by direct-push firms for groundwater sampling, should not be used for soil vapor samples because the polyethylene tubing has been shown to adsorb hydrocarbons. Check with the direct-push firm prior to the field program to ensure that they have and use proper tubing. In addition, it is important to properly store and handle the tubing. Any type of tubing will become contaminated and contribute to false positives if it is stored unsealed in the back of a truck or near the truck exhaust.
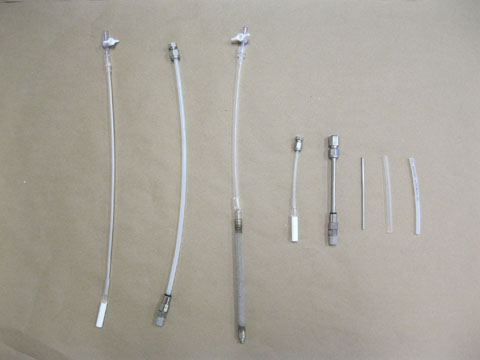
Figure G-9. Vapor sample materials, including ⅛-inch outer diameter tubing, three types of tips (ceramic, aluminum, and braided steel) and two types of surface terminations (stopcock and Swagelok fitting).
Source: H&P Mobile Geochemistry.
Nominally ⅛-inch or ¼-inch outer diameter tubing is recommended. Generally, ⅛-inch outer diameter tubing is easier to drop down a borehole than ¼-inch outer diameter tubing. If soil permeability tests are to be performed, the diameter should be a minimum of ¼ inch.
Stainless steel, aluminum, ceramic, or plastic (choice depends upon project specifications) probe tips are recommended. Note: Equipment blanks may have elevated levels of VOCs if probe tips are not properly cleaned (see Section G.10.6).
Swagelok fittings or plastic valves (two-way plastic valves or stop cocks) are best for sealing tubing that will remain in the ground for an extended time. It is important to secure the valve tightly to tubing, as the valve is a permanent component of the soil vapor collection system.
Options for surface termination include flush mounts on the floor/surface, belowground termination (with or without a locking cover), and various aboveground completions that are commercially available.
Collection of an equipment blank is recommended for all VI investigations, especially if metal probe tips are used. Zero-grade air or nitrogen should be drawn through the probe tubing, probe tip, and the sampling train at the start of the field program. The collected sample should be analyzed for the same compounds as the soil vapor samples. This practice confirms that the metal probe tips and other probe parts are clean before putting them in the ground.
When probes are installed, the in situ soil vapor can be displaced and a period of time is required for the soil vapor to reequilibrate to their predisturbed values. A recent USEPA study (Tetra Tech EM 2010) showed the following equilibration times were required to reach 80% of the final value, assumed to represent the predisturbed value:
This study was done in fine-grained soils, and equilibration times may be less in coarse-grained soils.
The time between probe installation and sampling depends on the investigation objectives and the data quality requirements. For example, if a soil vapor survey is conducted using temporary points to map the extent of a vapor plume, and the sample data are not intended for use in risk assessment or site closure decisions, then sampling sooner after installation would be acceptable. To obtain data for risk decision making, soil vapor probes consisting of tubing buried in a sand pack should be allowed to equilibrate for at least 8 hours before sampling.
If rotary drilling or percussion methods are used to place the tubes, longer periods of time are required for the sand pack to equilibrate with the soil vapor. The use of air knives is not recommended. To determine the equilibration time, a test of concentration versus time can be used to determine when values stabilize. Another method is to purge the soil vapor and monitor the soil vapor concentration with a portable meter. When the concentrations stabilize, equilibrium is assumed and a sample can be collected for analysis.
For collection systems with large purge volumes or designed to collect large sample volumes, it is often necessary to seal the probe at the surface. Seals may also be necessary for small volume systems if the soils are extremely porous and the sampling depth is close to the surface (less than 3 feet). The most common sealing technique is to grout the surface contact of the probe. If any other materials are used to seal the probe, they should be tested to ensure they are free from any COCs.
The sample collection equipment used for soil vapor surveys has an internal volume that is filled with air or some other inert gas prior to insertion into the ground. This internal volume, often called the dead volume, must be completely purged and filled with soil vapor to ensure that a representative soil vapor sample is collected. If tubing is installed and sampled the same day as installation, the air volume of the sand pack should also be included in the total system volume. Probe purging is typically accomplished using a pump or a syringe equipped with a three-way valve (see Figure G-7, Purging a probe with a plastic syringe). Syringes are an inexpensive and simple approach for purging small volumes up to 1 liter. For larger purge volumes, a pump with variable flow rates and a flowmeter is more efficient.
At a minimum, enough vapor should be withdrawn prior to sample collection to purge the probe and collection system of all ambient air or purge gas (1 purge volume). Some agencies define the number of purge volumes in their guidance.
While it is important to collect enough vapors to purge the system, collecting too much vapor can also have drawbacks. The larger the quantity of soil vapor withdrawn, the greater the potential that atmospheric air might be drawn into the probe, especially when sampling at shallow depths (less than 3 feet). Thus, sampling equipment with small internal dead volumes offers advantages over systems with larger dead volumes because the former systems require significantly less vapor to be withdrawn when purging the system.
Prevent Atmospheric Short-Circuiting
Since soil vapor data are often interpreted in a relative fashion, it is important that the purge volume be consistent for all samples collected at the same depth from the same site.
To minimize the potential desorption of contaminants from the soil, soil gas samples should be collected using techniques that minimize the vacuum applied to the soil. Higher vacuums also increase the potential for leaks in the sampling system. Most agencies require flows less than 200 mL/min.
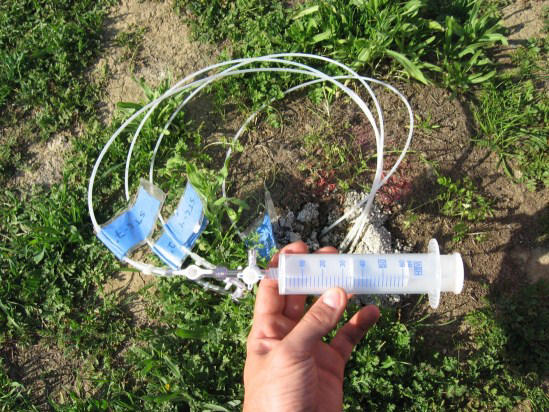
Figure G-10. Purging a probe with a plastic syringe.
Source: H&P Mobile Geochemistry.
Limiting flow rate may not be necessary in soils permeable enough to maintain vacuums less than 15% of atmospheric (about 5 inches of Hg, 60 inches of H2O). Studies have measured soil gas concentrations over different flow rates ranging from 100 mL/min to 100 L/min at a PHC contaminated site (USEPA 2010b; USEPA 2007c; McAlary and Cramer 2006). No significant differences in measured concentration were observed. This result suggests that for relatively coarse-grained soils (high permeability), flow rate does not appear to be an important variable for soil gas concentration.
Some U.S. agencies require applied vacuums at the probe to be less than 10 to 12 inches of Hg (100 inches water). A simple qualitative method is typically all that is necessary to estimate if there is little permeability and if too much vacuum is likely to be created during sampling. Connect a 20 cc to 50 cc gastight syringe to the probe, and pull on the plunger. If the plunger can be pulled easily, there is high permeability and the applied vacuum will likely be small. If the plunger is hard to pull (compared to pulling outside air) or if the plunger retracts towards the probe after being released, then there is likely too little permeability to obtain an uncompromised sample.
For low permeability soils, a quantitative method is preferable using a vacuum gauge placed between the probe and sample container (see Figure G-10). If canisters are being used to collect the soil vapor sample, be aware that a gauge on the Summa canister measures the vacuum in the canister, not the vacuum applied to the soil vapor probe, so an additional gauge must be emplaced in the sampling train between the flow regulator on the canister and the probe (Figure G-12). For gauges located on the flow restrictors, check with the supplying laboratory to determine whether they measure the vacuum in the canister or vacuum at the probe tip. Vacuum reading should be recorded on a sampling log sheet and compared to specifications set by the oversight agency (typically less than 10 inches of Hg).
When quantitative soil vapor data are desired (such as for risk assessments), leak testing the system as a quality assurance measure is strongly recommended and required by many state agencies. Leaks in the sampling train or leaks of ambient air into the probe tubing can result in diluting the soil vapor samples with ambient air and will result in underestimating actual contaminant concentrations in subsurface soil gas. Excessive vacuum conditions resulting from low porosity soils or high moisture content soils may exacerbate the potential for ambient air leakage. Two methods of leak detection are recommended: (1) performing a “shut-in” test of the sampling train and applying a leak detection compound or water to the vapor probe at the surface or (2) applying a tracer gas over the probe and over the entire sampling apparatus. Review any local VI sampling guidance for specific requirements for leak testing.
The shut-in test is performed by sealing the sampling train from the vapor probe tubing termination to the sample container (such as a Summa canister or Tedlar bag) and applying a vacuum to the sampling train. The applied vacuum should hold steady (not decrease) for at least 30 seconds. The start and end vacuum should be recorded and reported.
Figure G-11 shows an example of a simple sampling train arrangement for a shut-in test. The system consists of a two-way valve at the vapor probe termination, a vacuum gauge, and a three-way valve on a gastight syringe. The two-way valve is closed. A vacuum is then applied by drawing back the syringe plunger and the three-way valve is turned to shut off the syringe. The vacuum in the sampling train is then monitored for at least 30 seconds. If the sampling train does not hold the vacuum, then all connections should be rechecked and the shut-in test repeated.
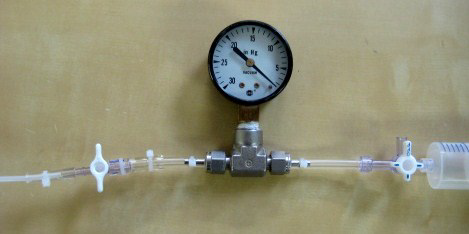
Figure G-11. Simple sampling train arrangement for a shut-in test using a syringe as the vacuum source.
Source: H&P Mobile Geochemistry.
Once the shut-in test has been successfully completed, a leak check compound or water is applied to the surface completion of the probe. The leak check compound can be applied by wetting a towel with a liquid compound (such as isopropanol) and placing it around the probe tubing at the ground surface (see Figure G-12) or by placing a small shroud over the surface completion and filling the shroud with a tracer gas (such as helium; Figure G-13). If water is used, place a pool of water around the probe and watch for changes in the water level. Refer to Appendix J, Section 5.2, in the New Jersey (2013a) guidance for more details of this method.
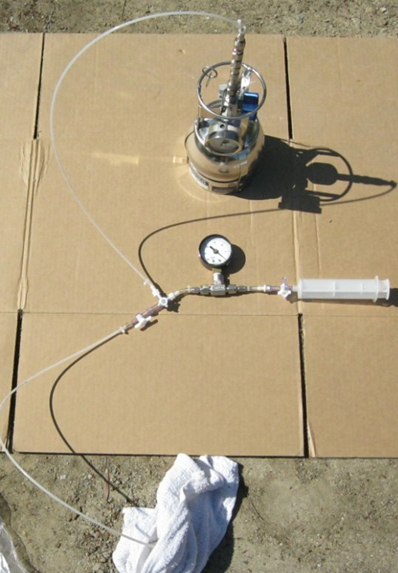
Figure G-12. Sampling arrangement showing probe tubing, leak check compound soaked into towel covering the probe at the ground surface.
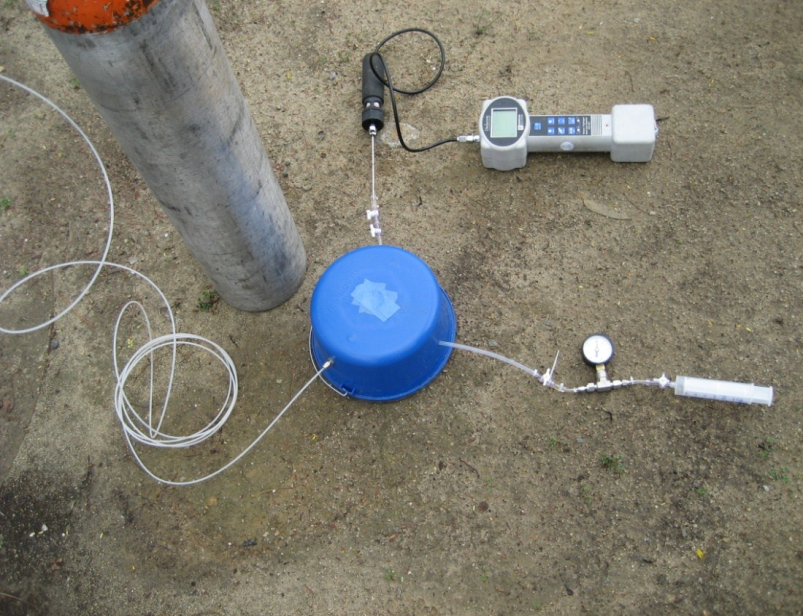
Figure G-13. Gas shroud over Vapor Probe Surface Completion. System consists of shroud (blue bucket), helium cylinder, field helium detector and syringe with vacuum gauge for purging.
Source: H&P Mobile Geochemistry.
The following video includes a demonstration of soil vapor sample collection with a Summa Canister:
Play video: Soil Vapor Sample Collection with Summa Canister
Method 2 involves enclosing the entire sampling apparatus, including sample container, all tubing and connections, and the vapor probe surface completion in a shroud, which is filled with a tracer (see Figure G-14). Disadvantages of this method are that it requires a large amount of gaseous tracer and it is difficult to turn on, turn off, and adjust the collection device once it is under the shroud.
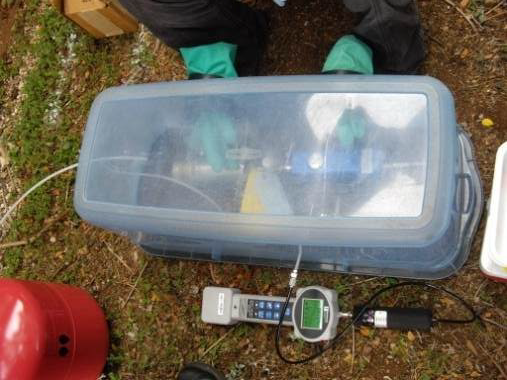
|
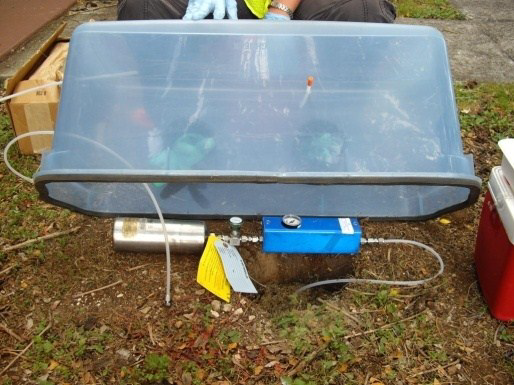
|
Figure G-14. Covering the entire sampling system and probe with a shroud.
Source: H&P Mobile Geochemistry.
For the methods described above, measure both the concentration of tracer compound in the shroud and the concentration of tracer compound in the soil vapor sample in the field using a handheld field meter or with an on-site lab. If canisters are being used, measure the tracer in the probe tubing after purging and prior to opening the canister. If the tracer concentration in the probe tubing is greater than 15% (note: some agencies have a lower allowed leak criterion) of the concentration in the shroud, then the leak should be found and corrected before opening the canister. After the canister has filled, test the probe tubing again. If the tracer concentration in the probe tubing is greater than 15% of the concentration in the shroud, then the sample in the canister may be compromised. The soil vapor sample in the canister should then be tested for the tracer at the laboratory. Fully document in the sampling log sheets both the shroud and probe tracer concentrations. Note that this procedure is more difficult to use if the entire sampling train is under the shroud (Method 2).
An alternative procedure is to first collect the sample in a Tedlar bag. Test the Tedlar bag for the tracer compound. If the tracer concentration in the Tedlar bag is less than 15% of the concentration in the shroud, the sample is considered valid and can be shipped to the laboratory or downloaded on site into a canister (see following section on sampling into Tedlar bags). If the tracer concentration in the Tedlar bag is greater than 15% of the concentration in the shroud (note: same agencies have lower allowed leak criterion), the sample is considered compromised, the leak should be found and corrected, and the sampling procedure repeated (the same Tedlar bag can be reused).
The selection of leak detection compounds is site- and analysis- specific. Considerations include whether it is a known or suspected contaminant at the site, or included in the laboratory’s list of target analytes for the method being used, and whether it can be monitored with portable measurement devices. Common leak detection compounds are isopropanol (rubbing alcohol), helium, and fluorinated ethanes (found in “duster” spray cans found at most office and computer supply stores). Each of the compounds has a variety of advantages and disadvantages (see Table G-2). Always check with the laboratory regarding potential interferences of leak-check compounds.
Isopropanol is readily available, inexpensive, and does not require the use of a shroud, as it can be applied to a towel placed around the vapor probe. Isopropanol can also be used with a shroud by placing the towel inside the shroud. A further advantage of isopropanol is that it can be detected using methods TO-14/15/17 or SW8260 and with a portable PID. Because it is handled at extremely high concentrations, however, it is possible to introduce high concentrations into the sample, which can render the sample useless by raising analytical reporting levels. When using liquid tracer compounds, take extreme care not contaminate the sampling train parts with tracer compound. Gloves should always be worn when handling the tracer compound, and a different pair of gloves should be worn when handling/assembling sampling train components. Although isopropanol can be detected by a portable PID, the PID might be reading other compounds in the soil vapor (such as BTEX) and give a false positive.
Fluorinated ethanes are readily available and simpler to handle than helium cylinders and can be detected using methods TO-14/15/17 or SW8260. However, like isopropanol, selective field meters are not readily available.
Helium concentrations can be readily measured in the field using a selective handheld meter. However, most helium meters such as a thermoconductivity He detector, also respond to methane, so if methane is suspected at the site, false positives on the helium meter are possible A further advantage of helium is that it’s presence in a sample, even at high concentrations, will not interfere with TO-14/15/17 or SW8260 analysis for VOCs. When using helium gas as a leak detection compound, ensure appropriate purity of the helium. Also keep in mind that the laboratory must run a separate analytical method to analyze for helium.
|
Compound |
Advantages |
Disadvantages |
|---|---|---|
|
Isopropanol |
|
|
|
Helium |
|
|
|
Fluoroethanes |
|
|
|
Sulfur hexa-fluoride (SF6) |
|
|
Sampling assemblies (such as connecting tubing, fittings, gauges, and flow controllers) should be confirmed to be leaktight using a shut-in test or tracer compound as described in the previous section and should be cleaned (and possibly blank tested) between soil gas samples if reused. Sample tubing should generally not be reused.
After purging, the canister should be connected to the probe tubing, but not opened, before applying the leak detection compound.
A vacuum gauge is used to measure the canister vacuum prior to sampling and the final vacuum after sampling. Prior to sampling, check the canister to ensure that sufficient vacuum is present. Laboratories typically place a vacuum of approximately 28 to 30 inches Hg on the canisters prior to shipment to the site. Field gauge readings, however, may differ. Field gauges typically have an accuracy of +/-5 psig. Additionally, sampling at altitude may impact field gauge readings (that is, for each 1,000 feet of elevation gain, the gauge may decrease by 1 inch Hg. For example, a canister reading 30 inches Hg at sea level may have a vacuum reading of 25 inches Hg at 5,000 feet).
Once the leak detection compound is applied, an aliquot of the soil vapor should be tested for the tracer compound before opening the canister. This test is typically done by having a sampling port next to the canister connection (using a Swagelok tee connection or a three-way plastic luer valve). If the leak detection compound is below acceptable levels, the canister can then safely be opened. If the leak detection compound is above acceptable levels, the canister is not opened, is disconnected, and the source of the leak is found and corrected. Using this procedure avoids filling canisters with soil vapor samples that fail the leak detection test. If a large-volume canister is being used (over 500 cc) or if the sample depth is very close to the surface (for example, subslab samples), the soil vapor probe should be retested for the leak detection compound after the canister is filled. This retest is necessary because the canister cannot be tested for the leak detection compound in the field, so if the soil vapor is leak free after the canister is filled, it is reasonable to conclude the sample in the canister is leak free also.
Soil Gas Grab Samples
For soil gas grab samples, it is recommended that the canisters be filled completely to 0 psig. The lack of a pressure gradient (no residual vacuum in the canister) minimizes the chance of leakage between sample collection and sample analysis.
Flow regulators, available from the laboratory, are placed on the canisters to reduce the flow. Canisters should not be cooled or left in the direct sunlight during storage or transport for analysis.
After purging and application of the leak detection compound over the probe, soil vapor can easily be transferred from the soil vapor probe into a gastight bag using a syringe (see Figure G-15).
Other devices such as a vacuum chamber (available from SKC, Inc. and other vendors) can also be used to fill gastight bags, but pumps upstream of the gastight bag should not be used because cross-contamination between samples will occur. The gastight bag should be filled, while being careful not to overinflate and potentially compromise the bag seals.
Using gastight bags offers the advantage of testing the actual soil vapor sample that will be later analyzed for VOCs for the leak detection compound (this is not possible with canisters as described previously). Connect the portable meter directly to the gastight bag and measure the tracer compound. If it is below acceptable levels, then the soil vapor sample is valid and the remaining amount in the gastight bag can be sent for analysis. If it is above acceptable levels, the gastight bag is easily emptied and can be reused for the same soil vapor sample location once the leak is found and corrected.
Storage time in gastight bags for most PHCs is approximately 48 hours. Gastight bags are generally not suitable for naphthalene. Not all gastight bags are the same, however, so use a bag that has been shown by the manufacturer or the laboratory to be stable for the compounds of interest. Care must be taken to not puncture or compress the bag during storage. It is best, but not necessary, to store the sample in the dark. The bags should never be chilled. If storage times longer than 48 hours are anticipated, or if a more durable storage container is desired, the sample in the gastight bag can easily be transferred into a passivated canister (see Figure G-13).
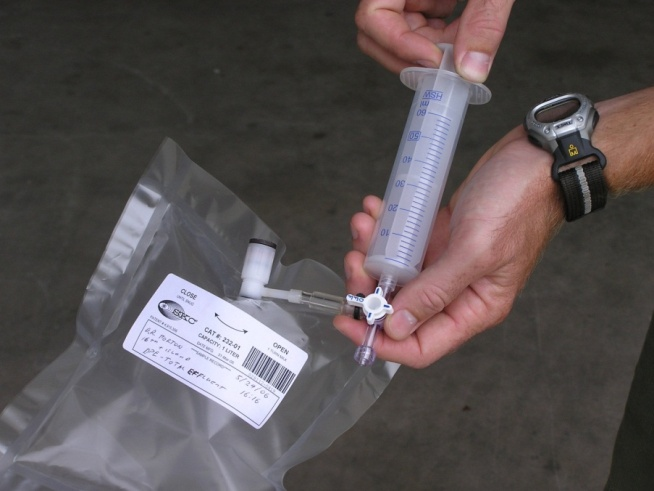
|
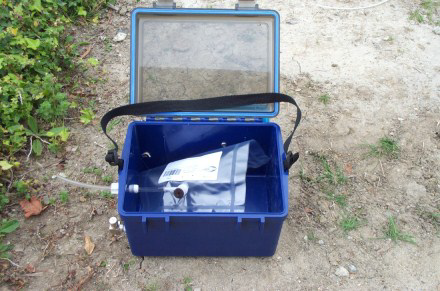
|
Figure G-15. (a) Filling a gastight bag using a syringe and three-way Luer valve. Top of the valve is connected to the probe tubing. (b) A vacuum chamber (sometimes called a lung-box) to inflate gastight bags.
Source: H&P Mobile Geochemistry.
|
|
|
Figure G-16. Transferring soil vapor sample from a gastight bag into a 400 cc canister.
Source: H&P Mobile Geochemistry.
Compound-specific isotope analysis (CSIA) can be used in VI investigations to help determine the source of VOCs in indoor air (VI versus indoor VOC source). The CSIA procedure relies on differences in the isotope signature between the subsurface VOC source and potential indoor VOC sources. Biodegradation of VOCs in the subsurface commonly results in an isotope fractionation effect. In contrast, isotope signatures from indoor VOC sources tend to fall within a narrow, and different, range. Sites with evidence of biodegradation are, therefore, likely to have subsurface sources with isotope signatures that are distinct from potential indoor sources. The sampling protocol for a CSIA evaluation involves sampling the subsurface source (for example, groundwater or soil gas) and indoor air, comparing the sample results, and comparing the indoor air results to the known isotope signature from indoor VOC sources.
Gastight glass vials and glass containers with valves or stopcocks can also be used for sample collection. Prior to sampling, the gastight vial should be evacuated to a vacuum of approximately -26 to -30 inches Hg. This can be easily done with an electric vacuum pump or with a hand vacuum pump that is typically available at automotive part stores (they are used for automotive brake repairs). A soil vapor sample is withdrawn using a syringe as described previously, except that a needle is placed on one side of the three-way plastic luer valve. The needle is pushed through the rubber septum on the evacuated vial and the soil vapor sample pushed into the vial. The vial is typically overpressured by adding a volume larger than the vial volume.
An evacuated glass container with a valve (BottleVac) is commercially available. This unit is filled similarly to an evacuated metal container. Glass bulbs are generally filled by allowing the soil vapor to flow through the bulb and closing the stopcocks on each end.
Since it is difficult to perform these sampling procedures under a shroud, leak detection is best done by performing a shut-in test on the sample train and then covering the probe with a small shroud or towel (leak test method 1). The soil vapor is tested for the leak detection compound before and after collecting the sample as described previously for canisters.
Soil vapor can easily be transferred from the soil vapor probe onto an adsorbent using the same syringe and three-way plastic valve used for Tedlar bags (see Figure G-17). The adsorbent tube is connected between the probe and the syringe so that the syringe pulls the soil vapor through the adsorbent. Other devices such as a low-flow pump can also be used to pass soil vapor over the adsorbent, but pumps upstream of the adsorbent should not be used as cross-contamination between samples will occur. Pumps should be calibrated before use to ensure correct measurement of volumetric flow. Also, the pump flow rate might change if the soil permeability changes. Sample flow rate should be to a flow rate of up to 50 mL/min for sampling in tight formations, and up to a maximum of 200 mL/min for sampling in permeable formations.
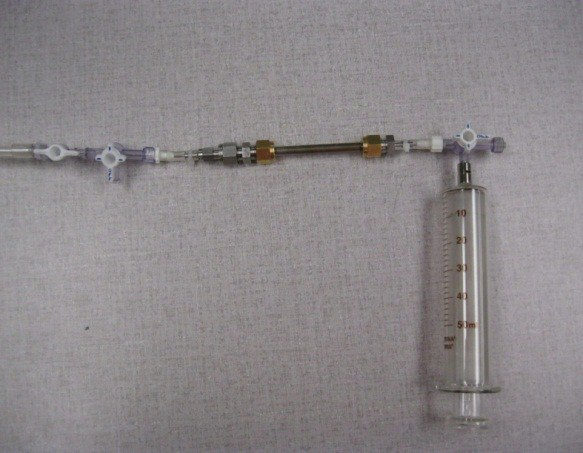
Figure G-17. Sampling arrangement for adsorbent tubes.
Source: H&P Mobile Geochemistry.
The laboratory should provide guidance on the type of adsorbent for the VOCs of interest and on required tube sampling volumes based on their detection limits. Often, two tubes are placed in series in case there is any breakthrough of the COCs from the first tube. An alternative approach is to collect two tubes at each sampling location: one sample at the laboratory recommended sample volume to reach the detection limits and a second sample collected at 10% of the laboratory recommended sample volume. The lower volume sample is then available for analysis if the higher volume sample is saturated by PHCs. The sample volumes might be adjusted downward if high concentrations are expected or detected at the sampling location.
Leak detection is best performed using the shut-in test procedure for the sampling train and a shroud or towel over the surface of the probe.
After sampling, the tubes are sealed, transferred to the laboratory supplied sample container, and stored with ice within a cool box.
Local Requirements
Check local guidance to determine whether more than one round of soil vapor sampling is required by the agency, regardless of the measured values.
For fuel related compounds (TPH, BTEX) and biogenic gases (CH4, CO2, and O2), allowable containers include Tedlar bags, gas tight vials (glass or stainless steel), and passivated stainless steel canisters (Summa). Tedlar bags are generally not considered to be reliable for more than 48 hours, but some agencies may have different requirements.
For halogenated compounds (such as TCE, TCA, and PCE), allowable containers must be gas tight, but also dark to eliminate potential effects due to photo destruction. Adsorbents are suitable for most VOCs and SVOCs; however, multiple adsorbents may be required to deal with complex mixtures.
Be aware of sample storage requirements. If stored samples are to be subjected to changes in ambient pressure (such as shipping by air), gastight vials or canisters are recommended. To prevent the chances of rupture, Tedlar bags should only be partially filled if shipped by air. Allowable storage times in canisters vary with each state. Most agencies require analysis within 14 days of collection. It is not necessary to chill soil gas samples during shipping and storage. However, method TO-17 requires adsorbent tubes to be stored at less than 4º C.
Subslab samples refer to active or passive soil gas samples collected from immediately below a slab on grade or a basement floor slab. The procedure involves drilling through the concrete slab and collecting a soil gas sample for field or laboratory analysis. Subslab soil gas samples are sometimes collected concurrently with indoor air samples so that the subslab concentrations can be directly compared to indoor air concentrations collected at the same time.
A typical subslab probe is constructed from small diameter (⅛ inch or ¼ inch outer diameter) stainless steel or another inert material and stainless steel compression fittings. Other probe designs consist of a barb fitting at the surface, which offers advantages in that the fitting is less likely to break loose from the cement upon sampling. The probes are cut at a length to either float in the slab or to extend just to the base of the slab (see Figure G-19). If repeated sampling is anticipated, surface completions may need to be flush with the surface (trip-proof) and cosmetically clean, especially in residences.
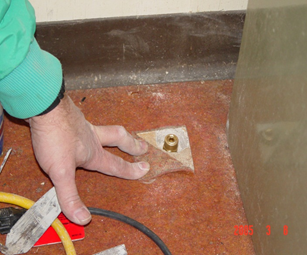
Figure G-18. Installation of subslab soil gas sample port.
Source: Kansas DHE.
Special considerations for subslab soil gas samples include:
A standard operating procedure for subslab sampling was published by USEPA in March 2006 (USEPA 2006a). NJDEP (2005) has a modified version of these procedures in its guidance document. There is also a standard operating procedure in the EPRI handbook (2005).
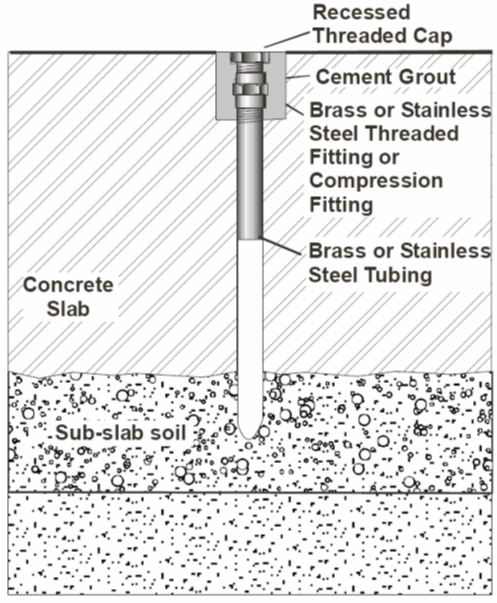
Figure G-19. General schematic for installation of subslab vapor probes.
Source: USEPA 2006.
A variety of analytical methods are available to measure vapor samples (soil gas, ambient air and indoor air) all of which can give accurate results when followed with appropriate QA/QC (Table G-4).
The primary criteria for choosing the appropriate method are:
Discussions with the laboratory should be included during the planning stages of the investigation to ensure the appropriate analytical method is used.
Method TO-15 is commonly used for VOCs in indoor and ambient air samples. A driver behind using these methods is the ability to achieve very low reporting limits (RLs). Using the method that can achieve the lowest reporting limits is not always the best or most viable option. TO-15 uses a GC/MS. The MS can be run in two different modes: full scan and selective ion monitoring (note that some compound selectivity and the ability to identify unknowns may be lost in the use of selective ion monitoring analysis due to limiting the masses scanned). Standard TO-15 is normally run in the full scan mode and can give a list of approximately 70 compounds with RLs ranging from 0.2 to 0.5 parts per billion by volume (ppbv). This analyte list and RLs are generally more than sufficient when analyzing soil gas. In the selective ion monitoring mode, TO-15 has the ability to reach RLs ranging from 0.002 to 0.010 ppbv for a smaller list of approximately 12 to 15 compounds. Compound lists and achievable reporting limits in the two different modes are laboratory specific, so check with the laboratory to determine which approach they recommend in order to meet DQOs. Because soil gas samples generally have COCs at higher concentrations than the selective ion monitoring method can calibrate to, the selective ion monitoring method is rarely needed for soil gas samples.
Sorbents based methods (TO-17) allow for the capturing of VOCs and SVOC’s beyond the capability of TO-15; TO-17 and can be used for compounds in the C3–C28 volatility range. Either method can be used to capture naphthalene based on the laboratory capabilities. For light-end PAHs and diesel range organics, TO-17 is the appropriate method. TO-15 is only appropriate for TPH as gasoline, but TO-17 can be used for TPH gasoline-range and TPH diesel-range organics.
QA/QC protocols may vary greatly between laboratories, so the practices should be reviewed and specified in the work plan prior to data collection. Data validation methods (when required by the regulatory agency) should also be specified and approved in advance. More information is presented in Section G.12.
On-site analysis provides real-time detection of VOCs from any vapor migration sources or pathways, allows additional sampling locations to be added (spatially or vertically) based upon the real-time data, allows recognition of suspect data, and enables measurement of the leak-test compound to ensure valid soil gas samples are collected.
Simple portable instruments can provide both qualitative and quantitative data depending upon the compound and the required detection levels. Field screening with handheld PIDs or FIDs enables rapid screening for vapor migration routes around and into structures. Most field screening instruments, however, are limited to the ppmv range, which does not provide sufficient sensitivity for vapor intrusion investigations. Quantitative O2, CO2, and CH4 data are possible from handheld portable meters for concentrations in the percent range. Helium detectors are available with a range of 0.01% to 100% by volume.
For lower detection limits, mobile laboratories equipped with laboratory grade instruments, including gas chromatographs and mass spectrometers, are capable of fully quantitative results meeting method required QA/QC and detection limits as low as 1 to 100 μg/m3. Other instruments, such as portable GC/MS and small-footprint gas chromatographs are also available.
There are a variety of methods to quantify PHCs in vapor samples. In selecting a method, it is important to understand what kind of information is needed and what the ultimate use of the data will be. Some methods will provide a TPH value, and other methods will provide specific fractions (aliphatic hydrocarbons and aromatic hydrocarbons). These fractions typically are reported for a certain carbon range, such as C5–C8 or C9–C12. Table G-3 lists some of the more typical analyses that provide either a TPH value or a petroleum fraction value. It is best to verify with the oversight agency whether they have a required or preferred method for PHC analysis. If no method is specified, it is best to check with the laboratory on the following items when choosing the appropriate method for your site.
A checklist of items to address with the laboratory includes the following:
Note: Party grade helium may contain hydrocarbons that could interfere with sample analysis.
Compounds used as tracer gases during leak check procedures can be problematic to TPH analysis. Certain tracer gas compounds (isobutane, isopropyl alcohol) have a direct impact on the quantitation of PHCs if present at elevated concentrations (greater than 0.01%) by causing (a) a false positive, and (b) elevated reporting limits due to significant dilutions performed by the laboratory. Other tracer gas compounds used (1,1-difluoroethane, sulfur hexafluoride) may not cause a false positive, but may also lead to elevated reporting limits if present at elevated concentrations. Helium is the least problematic tracer gas because it can be measured in the field and does not interfere with PHC analysis for either (a) or (b) listed previously. Helium may require additional analysis at the laboratory.
Nonpetroleum compounds are detected using either the FID or MS detectors. Compounds such as oxygenates (ethanol, MTBE), methane, CVOCs, and the leak/tracer compound can lead to an increase in the reported TPH value if they are not subtracted from the TPH result by the laboratory.
Naturally occurring non-PHCs, such as limonene and pinenes, can typically cause a high bias in the C9–C12 hydrocarbon range. Other site-related contaminants (CVOCs) and typical indoor air background analytes (such as ethanol, acetone, and 2-butanone) also cause a high bias result, typically in the C4–C8 hydrocarbon range. A study comparing results from analysis by USEPA Method TO-15 to results from the Massachusetts APH method showed high bias in the APH results for both C5–C8 and C9–C12 ranges, in both soil gas and indoor air samples (Goshorn et al. 2012). The various methodologies that are used for PHC quantitation may or may not provide guidance as to how to address the nonpetroleum analytes. In addition, methods that use an FID may not be able to identify the nonpetroleum analytes, whereas methods using the MS detector can identify the nonpetroleum analyte via their mass spectrum and thus exclude the analyte from the PHC quantitation.
CVOCs typically used as lead scavengers (1,2-dichloroethane, ethylene dibromide) in leaded gasoline supplies can typically be analyzed using methods 8260, TO-15, or TO-17. Oxygenates (ethanol, tert-butyl-alcohol, MTBE, tert-amyl-methyl-ether, tert-butyl-ethyl ether and others) can also be readily analyzed using the same methods. Some methods may not reach necessary screening levels, so confirm with the laboratory which methods will meet site-specific screening levels.
A variety of methods are currently being used to analyze for naphthalene, such as 8260, TO-15, TO-17, and TO-13. Technically, naphthalene fails the vapor pressure requirement stated in method TO-15 (greater than 0.5 inches of Hg), but many laboratories have demonstrated adequate compound recoveries using this method. It is best to verify with the oversight agency as to what is the preferred method for naphthalene analysis.
For hydrocarbon carbon ranges (C13–C28) and PAHs considered in the semivolatile range, a sorbent-type sampling and analysis is better suited. Method TO-13A is specific for the quantitation of PAHs in air, and method TO-17 can be used for lighter-end PAHs as well as diesel range hydrocarbon analysis.
Fixed gases, typically defined as O2, nitrogen, CH4, CO2, and CO, can readily be analyzed using laboratory-based methods that use a thermal conductivity detector for detection, and also using field monitoring devices (landfill gas monitors). ASTM D1945 and USEPA Method 3C are two of the more common analytical methods and can typically detect concentrations as low as 0.1%. These methods can also be used to analyze for helium, which is often used as a tracer gas during leak check procedures in soil gas sampling. Sorbent tube methods (TO-17, TO-13) are not suitable for fixed gas analysis since the sorbents will not readily adsorb fixed gases.
If source determination of methane is needed (landfill gas, thermogenic, or biogenic), isotopic techniques are available.
1,3-butadiene can be a COC at PHC sites and is a by-product of combustion, but not a compound in refined petroleum or crude petroleum. Ultra-low screening values increase the possibility of false positives. Isobutylene, a biogenetically produced gas, can elute closely to 1,3-butadiene on various chromatographic columns and has a similar mass fragment leading to a potential false positive if present at elevated concentrations.
The hydrocarbon analyte lists that can be reported by Method TO-15 have been extended to include more than 80 individual PHCs covering a carbon range from C5 (n-pentane) to C12 (n-dodecane). The reporting list includes many classes of PHCs such as n-alkanes, branched alkanes, cycloalkanes, alkenes, and aromatic hydrocarbons. Analysis of vapor-phase samples for an extended list of PHCs provides an improved understanding of the actual composition of the sample. These results can be used to more accurately identify the source(s) of the detected PHCs and to evaluate toxicity.
The concentration and distribution of individual PHCs and classes of PHCs in a sample can be used to identify the likely sources of the PHCs. Primary sources can be identified by comparing the overall pattern of detected PHCs between samples (see Figure G-20) or by looking for compounds indicative of specific sources. For example, cigarette smoke contains high concentrations of isoprene (a branched alkene) and weathered gasoline is typically enriched in 2,2,4-trimethylpentane relative to fresh gasoline. In addition, alkenes, which are created during the refining process, are generally absent from crude oil, but present in refined petroleum products such as gasoline. At PVI sites, hydrocarbon fingerprinting analysis may be particularly useful for distinguishing between VI and indoor PHC sources.
|
|
|
|
VPH Fingerprints for cigarette smoke and Residence 8 indoor air |
VPH Fingerprints for fresh gasoline and House 5 garage air |
Figure G-20. VPH fingerprints for cigarette smoke vs. House 8 indoor air (left panel) and fresh gasoline vs. House 5 indoor air (right panel).
Source: McHugh et al. 2011.
The hydrocarbon analyte lists that can be reported by Method TO-15 have been extended to include vapor phase PIANO list (paraffin, isoparaffins, aromatics, naphthalenes, and olefins) and additional vapor phase markers for MGP and other distillate fuels. As the carbon number increases over C12, the volatility of the compound limits the performance and recovering of the PHCs from a passivated canister. Method TO-17 samples capture on sorbent with active sampling has some utility in extending the range of the PHCs that can be reported.
|
Measurement approaches |
Source at depth (>5ft) directly under building |
Shallow source (<5ft) under building |
Source in vadose zone adjacent to building |
Special conditions |
||||||||||||
|---|---|---|---|---|---|---|---|---|---|---|---|---|---|---|---|---|
|
|
Undev. site |
Res. w/ basement or slab-on grade floor |
Res. w/ dirt floor or crawl space |
Comm./ Industrial |
Undev. site |
Res. w/ basement or slab-on grade floor |
Res. w/ crawl space or dirt floor |
Comm./ industrial |
Undev. Site |
Res. w/ basement or slab-on grade floor |
Residential with crawl space or dirt floor |
Comm./ industrial |
PHCs |
Vapor migration routes |
Wet basement |
Very low permeability soils |
|
Shallow groundwater (near water table) |
● |
● |
● |
● |
● |
○ |
○ |
○ |
○ |
○ |
○ |
○ |
◒ |
○ |
● |
○ |
|
Deep (>5ft) soil gas |
● |
● |
● |
● |
NA |
NA |
NA |
NA |
● |
● |
● |
● |
● |
○ |
NA |
NA |
|
Shallow (5 ft) soil gas |
● |
● |
● |
● |
● |
● |
● |
● |
● |
● |
● |
● |
● |
● |
NA |
NA |
|
Subslab soil gas |
NA |
● |
NA |
● |
NA |
● |
NA |
● |
NA |
◒ |
NA |
◒ |
● |
○ |
NA |
● |
|
Vertical profile of soil gas |
○ |
○ |
○ |
○ |
NA |
NA |
NA |
NA |
○ |
○ |
○ |
○ |
● |
○ |
NA |
NA |
|
Indoor air |
NA |
◒ |
◒ |
◒ |
NA |
◒ |
◒ |
◒ |
NA |
◒ |
◒ |
◒ |
◒ |
● |
◒ |
◒ |
|
Ambient (outdoor) air |
○ |
○ |
○ |
○ |
○ |
○ |
○ |
○ |
○ |
○ |
○ |
○ |
○ |
○ |
○ |
○ |
|
Passive soil gas sampling |
◒ |
◒ |
◒ |
◒ |
◒ |
◒ |
◒ |
◒ |
◒ |
◒ |
◒ |
◒ |
◒ |
◒ |
○1 |
◒ |
|
Emission flux chambers |
○ |
NA |
◒ |
○ |
○ |
NA |
◒ |
○ |
○ |
NA |
◒ |
○ |
○ |
NA |
NA |
○ |
|
Tracers testing for alpha factor |
NA |
○ |
○ |
○ |
NA |
○ |
○ |
○ |
NA |
NA |
NA |
◒ |
○ |
○ |
NA |
○ |
|
Tracer testing for ventilation rate |
NA |
○ |
○ |
◒ |
NA |
○ |
○ |
◒ |
NA |
○ |
○ |
○ |
○ |
○ |
○ |
○ |
|
Pressure differential monitoring |
NA |
○ |
○ |
○ |
NA |
○ |
○ |
○ |
NA |
○ |
○ |
○ |
○ |
○ |
NA |
○ |
|
Real-time analyzers |
○ |
○ |
○ |
○ |
○ |
○ |
○ |
○ |
○ |
○ |
○ |
○ |
○ |
○ |
○ |
○ |
|
Meteorological data |
○ |
○ |
○ |
○ |
○ |
○ |
○ |
○ |
○ |
○ |
○ |
○ |
○ |
○ |
○ |
○ |
|
This rating indicates that each tool can be used for the category lower in the hierarchy. 1This is dependent on the passive sampler device.
Key: ● = Primary investigative tool; data can potentially be used as a principle tool for assessing VI ◒ = Secondary investigative tool; can be used to develop CSM and/or as a line of evidence in support of another line of evidence ○ = Optional investigative tool; may be useful to further define VI pathway or as means to focus primary investigative tools NA = not usually appropriate as an investigative tool for VI assessment |
||||||||||||||||
|
Measurement |
Advantages |
Disadvantages |
Comments |
|---|---|---|---|
|
Deep soil gas (>5 ft. below slab) |
|
|
When combined with other data, deep soil gas data can provide evidence of biodegradation as a function of vertical transport distance. Deep soil gas sampling, however,is conservative for screening purposes. |
|
Shallow soil gas (e.g., <5 ft. below slab or basement floor) |
|
|
Building zone of influence must be taken into consideration in sampling design. Shallow soil gas sampling may not be conservative for screening purposes. |
|
Subslab soil gas |
|
|
Preferred approach of many regulatory agencies. Concurrent determination of slab-specific attenuation factor may be useful to interpret data. |
|
Emission flux |
|
|
This approach is best suited for evaluating future use scenarios on undeveloped land, houses with dirt floor basements or crawl spaces, and to confirm biodegradation in shallow vadose zone (<3’ bgs). |
|
Soil gas attenuation (a) factors |
|
|
Attenuation factors may be based on empirical measurements of concentration ratios at other sites or on assumed Qsoil and building ventilation flow rates. |
|
Slab-specific attenuation factor determination (from subsurface tracer) |
|
|
Method assumes that the tracer and subsurface contaminants move into the building at the same rate. |
|
Indoor air |
|
|
Time-integrated samples are typically collected (e.g., 24-hr samples for residential sites and 8-hr samples for industrial sites). |
|
Crawl space air |
|
|
Most guidance uses an attenuation factor of 1.0 between crawl space and indoor air. |
|
Pressure differential |
|
|
Detection levels down to 1 Pa can be obtained using inexpensive 0 – 0.25” H₂O magnahelic gauge. |
|
Building ventilation rate |
|
|
Fewer sampling locations are needed if additional mixing of air within building is provided. Most commonly used for commercial receptors. |
|
Forensics |
|
|
Forensic approaches are not likely to be used until later rounds of an investigation. |
|
Continuous analyzers |
|
|
Larger data sets allow correlation to other variables such as pressure differentials, wind speed, and HVAC systems. |
|
Soil physical properties |
|
|
Most sensitive soil physical properties to measure are % water content and permeability. |
|
Groundwater data |
|
|
This approach is often used as an initial screen. |
|
J & E model with groundwater or soil gas data |
|
|
The accuracy of the model output is best if the pollutant transport distance is at a minimum (shallow soil gas is better than deep soil gas) and no partitioning calculations are needed (soil gas data are better than groundwater data). |
|
Biodegradation models |
See Appendix H |
|
|